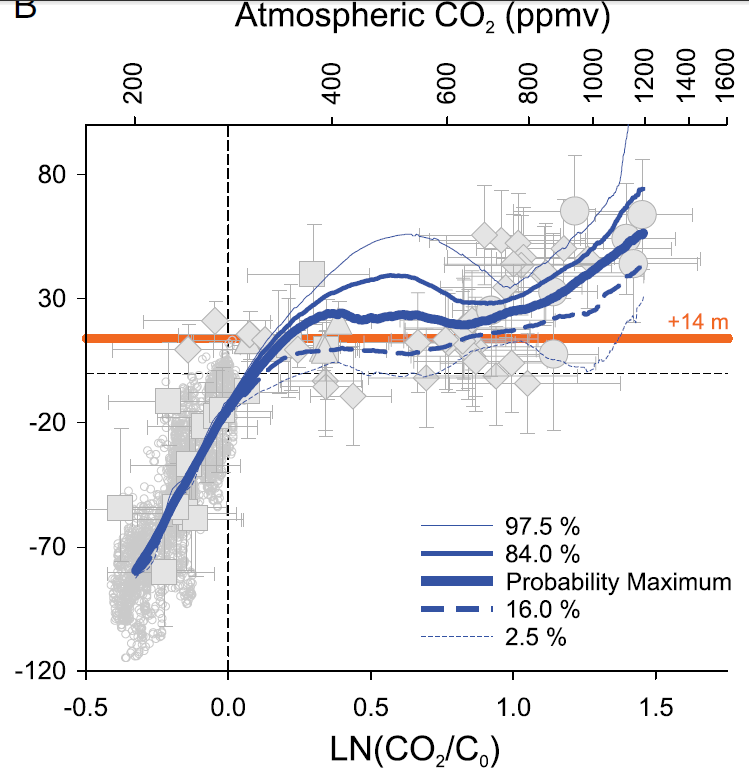
Cross-plot of estimates of atmospheric CO2 and coinciding sea level… (B) Results from our probabilistic analysis of the data that fully accounts for uncertainty in both X and Y parameters … dotted lines denote the preindustrial conditions of 0 m and 280 ppm CO2. The horizontal orange line shows +14 m, which is the sea-level rise associated with the total melting of WAIS and GrIS (31). (WAIS= West Antarctic Ice Sheet, GrIS=Greenland Ice Sheet) Source: “Relationship between sea level and climate forcing by CO2 on geological timescales”, Gavin L. Foster and Eelco J. Rohling, Sept 2012 - |