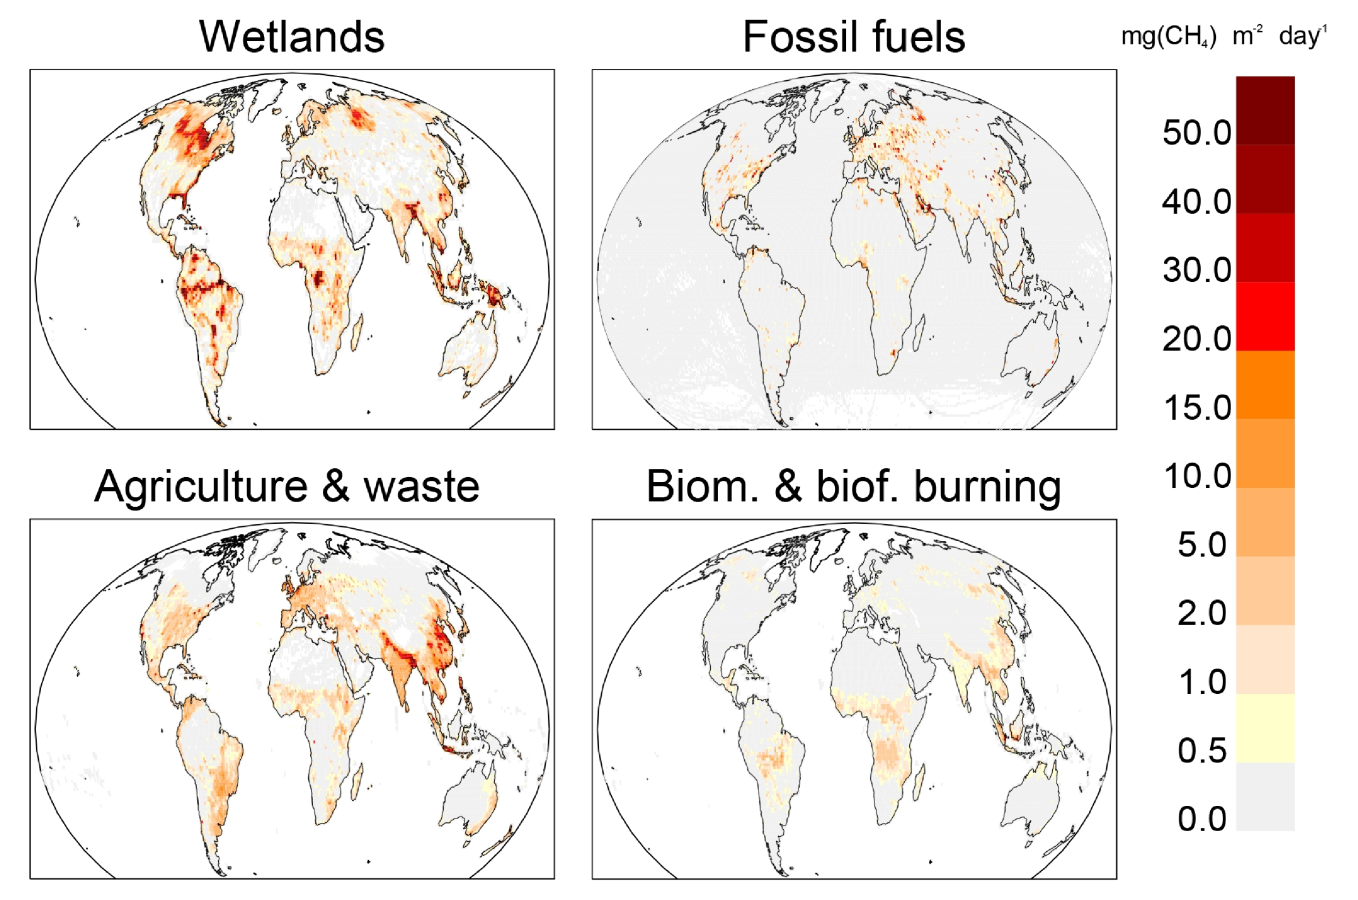
Figure 3. Methane emissions from four source categories: natural wetlands, fossil fuels, agriculture and waste, and biomass and biofuel burning for the 2003–2012 decade in mg CH4 m-2 day-1. The wetland emission map represents the mean daily emission average over the 11 biogeochemical models listed in Table 1 and over the 2003–2012 decade. Fossil fuel and agriculture and waste emission maps are derived
from the mean estimates of EDGARv4.2FT2010 and GAINS models. The biomass and biofuel burning map results from the mean of the biomass burning inventories listed in Table 1 added to the mean of the biofuel estimate from EDGARv4.2FT2010 and GAINS models. |