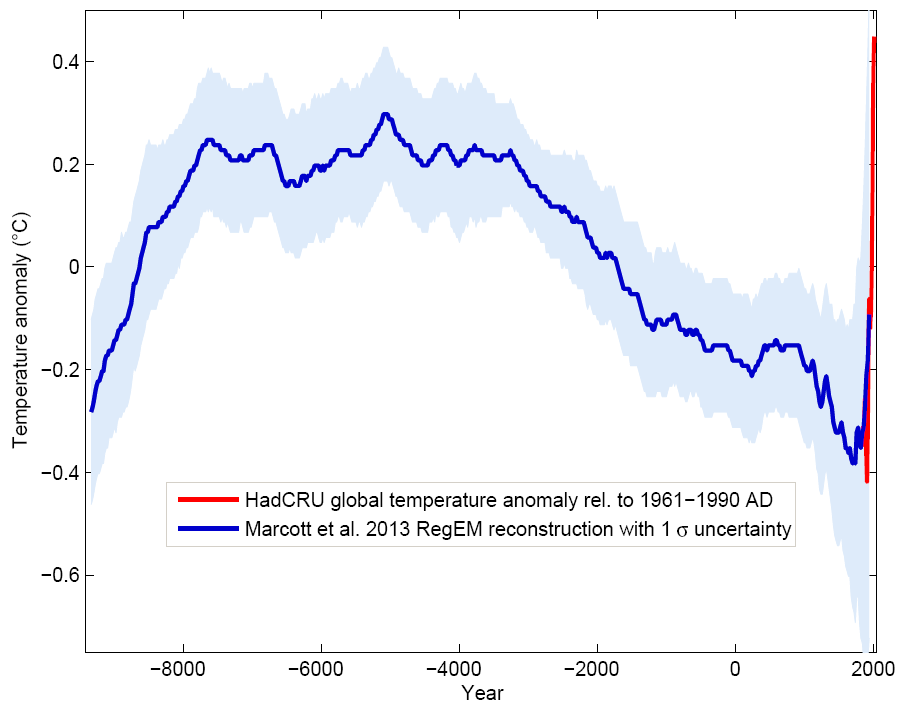
Blue curve: Global temperature reconstruction from proxy data of Marcott et al, Science 2013. Shown here is the RegEM version – significant differences between the variants with different averaging methods arise only towards the end, where the number of proxy series decreases. This does not matter since the recent temperature evolution is well known from instrumental measurements, shown in red (global temperature from the instrumental HadCRU data). Graph: Klaus Bitterman. - Click here for more information | The climate curve looks like a “hump”. At the beginning of the Holocene – after the end of the last Ice Age – global temperature increased, and subsequently it decreased again by 0.7 ° C over the past 5000 years. The well-known transition from the relatively warm Medieval into the “little ice age” turns out to be part of a much longer-term cooling, which ended abruptly with the rapid warming of the 20th Century. Within a hundred years, the cooling of the previous 5000 years was undone. - Click here for more information |