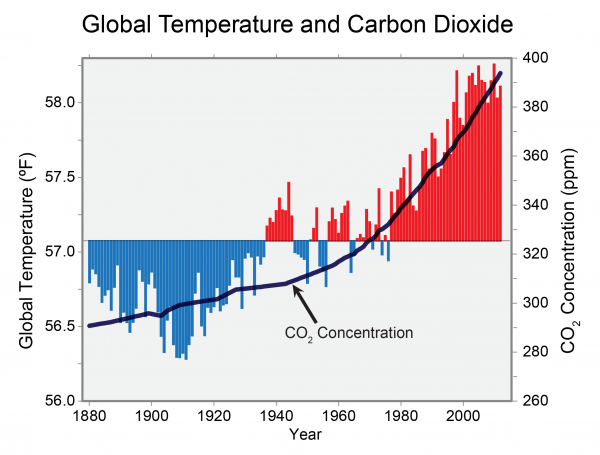
The Global Surface Temperature is Rising
Global annual average temperature measured over land and oceans. Red bars indicate temperatures above and blue bars indicate temperatures below the 1901-2000 average temperature. The black line shows atmospheric carbon dioxide concentration in parts per million. | Global average temperature is one of the most-cited indicators of global climate change, and shows an increase of approximately 1.4°F since the early 20th Century. The global surface temperature is based on air temperature data over land and sea-surface temperatures observed from ships, buoys and satellites. There is a clear long-term global warming trend, while each individual year does not always show a temperature increase relative to the previous year, and some years show greater changes than others. These year-to-year fluctuations in temperature are due to natural processes, such as the effects of El Ninos, La Ninas, and the eruption of large volcanoes. Notably, the 20 warmest years have all occurred since 1981, and the 10 warmest have all occurred in the past 12 years. |