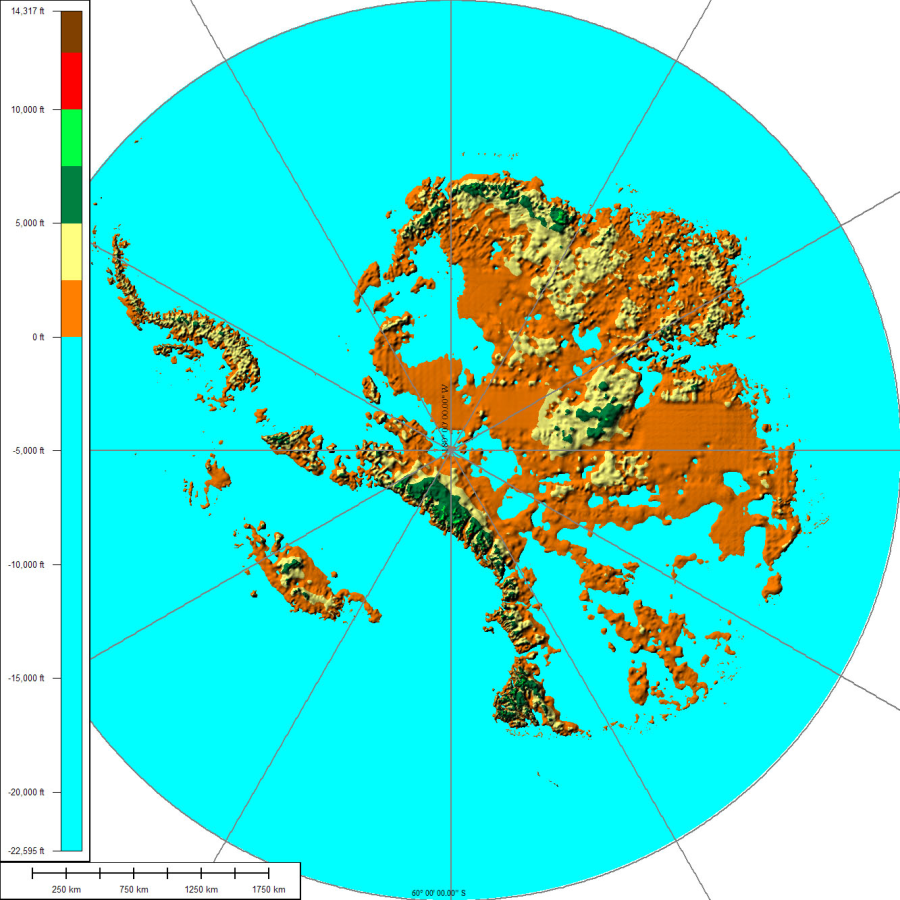
The above map shows the subglacial topography of Antarctica. As indicated by the scale on left-hand side, blue represents portion of Antarctica lying below sea level. The other colors indicate Antarctic bedrock lying above sea level. Each color represents an interval of 2,500 ft (760 m) in elevation. Map is not corrected for sea level rise or isostatic rebound, which would occur if the Antarctic ice sheet completely melted to expose the bedrock surface. | The icing of Antarctica began with ice-rafting from middle Eocene times about 45.5 million years ago[5] and escalated inland widely during the Eocene–Oligocene extinction event about 34 million years ago. CO2 levels were then about 760 ppm[6] and had been decreasing from earlier levels in the thousands of ppm. Carbon dioxide decrease, with a tipping point of 600 ppm, was the primary agent forcing Antarctic glaciation.[7] The glaciation was favored by an interval when the Earth's orbit favored cool summers but Oxygen isotope ratio cycle marker changes were too large to be explained by Antarctic ice-sheet growth alone indicating an ice age of some size.[8] The opening of the Drake Passage may have played a role as well[9] though models of the changes suggest declining CO2 levels to have been more important.[10] |