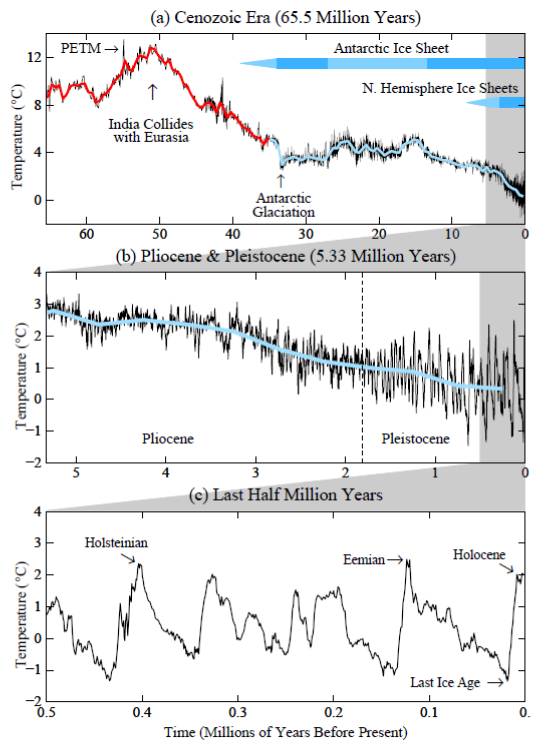
Fig. 1. Global deep ocean temperature in the Cenozoic Era, with th
e Pliocene and Pleistocene expanded
in (b) and the last half million years further expanded in (c).
H
igh frequency variations (black) are 5
-
point running means of original data (Zachos et al., 2001), while the red and blue curves have 500 ky
resolution.
Blue bars indicating ice sheet presence are darker when ice sheet
s were close to their full size |