Antarctic
This Fact Page displays text and images related to global warming and climate change
(Hover your mouse over the text below to "popup" a window with a related text.
Click on the text or image to open a new window with a detailed description.)
|
|
| Antarctic ice melt is twice as fast as ten years ago | | Antarctic ice melt is twice as fast as ten years ago | 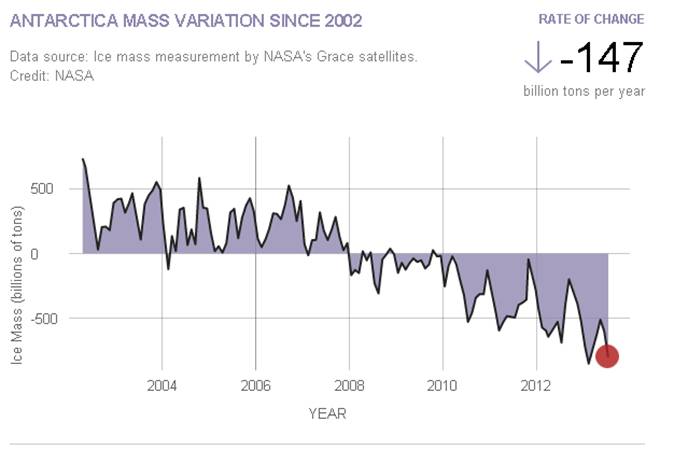
Image source: http://climate.nasa.gov/vital-signs/land-ice/ | 'Antarctic ice losses have DOUBLED in less than a decade with 159 billion tonnes of ice melting each year', reads today's Daily Mail headline. The Guardian opts for, 'Doubling of Antarctic ice loss revealed by European satellite'. The Times says 'Antarctic melt rate worries scientists'.
All three headlines stem from a paper published yesterday in Geophysical Research Letters, which finds the volume of ice melting into the ocean from Antarctica is twice as large the average between 1992 and 2011, now raising global sea levels by 0.45 millimetres a year.
The University of Leeds scientists study uses three years of data from the European Space Agency's CryoSat-2 satellite, launched in 2010. The satellite now sees five times as much area as before, totalling 96 per cent of the total Antarctic continent.
David Vaughan from the British Antarctic Survey told The Guardian why this is so important:
"Through some very clever technical improvements, [the scientists] have produced the best maps of Antarctic ice-loss we have ever had. Prediction of the rate of future global sea-level rise must be begin with a thorough understanding of current changes in the ice sheets - this study puts us exactly where we need to be."
Across Antarctica, the average height of the ice is dropping by 1.9 centimetres per year, the data shows. East Antarctica is staying roughly the same but West Antarctica is seeing big losses, where ice melt is 31 per cent faster now than between 2005 and 2011. Ice loss from glaciers along the Amundsen coast has tripled over the past two decades, the paper explains. | | | Source: carbonbrief | URL: http://www.carbonbrief.org/blog/2014/05/ice-picks-five-pieces-of-ice-news-revealing-earth%E2%80%99s-ice-cover-is-in-serious-decline/
(The text for the image(s) on this Web page was taken from the above source.) |
| Sea level rise contributors | 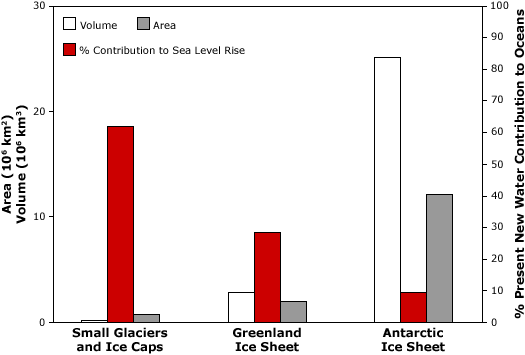
Sea level rise contributors
Comparison of volume (white), area (grey) and percent contribution to sea level rise (red) by small glaciers and ice caps, and the Greenland and Antarctic Ice Sheets. Image courtesy (Meier et al., 2007). | Current conditions: contribution from melting glaciers
Global sea level is currently rising as a result of both ocean thermal expansion and glacier melt, with each accounting for about half of the observed sea level rise, and each caused by recent increases in global mean temperature. For the period 1961-2003, the observed sea level rise due to thermal expansion was 0.42 millimeters per year and 0.69 millimeters per year due to total glacier melt (small glaciers, ice caps, ice sheets) (IPCC 2007). Between 1993 and 2003, the contribution to sea level rise increased for both sources to 1.60 millimeters per year and 1.19 millimeters per year respectively (IPCC 2007).
Antarctica and Greenland, the world's largest ice sheets, make up the vast majority of the Earth's ice. If these ice sheets melted entirely, sea level would rise by more than 70 meters. However, current estimates indicate that mass balance for the Antarctic ice sheet is in approximate equilibrium and may represent only about 10 percent of the current contribution to sea level rise coming from glaciers. However, some localized areas of the Antarctic have recently shown significant negative balance, e.g., Pine Island and Thwaites Glaciers, and glaciers on the Antarctic Peninsula. There is still much uncertainty about accumulation rates in Antarctica, especially on the East Antarctic Plateau. The Greenland Ice Sheet may be contributing about 30 percent of all glacier melt to rising sea level. Furthermore, recent observations show evidence for increased ice flow rates in some regions of the Greenland Ice Sheet, suggesting that ice dynamics may be a key factor in the response of coastal glaciers and ice sheets to climate change and their role in sea level rise.
In contrast to the polar regions, the network of lower latitude small glaciers and ice caps, although making up only about four percent of the total land ice area or about 760,000 square kilometers, may have provided as much as 60 percent of the total glacier contribution to sea level change since 1990s (Meier et al. 2007). | | | Source: NSIDC | URL: https://nsidc.org/cryosphere/sotc/sea_level.html
(The text for the image(s) on this Web page was taken from the above source.) |
| Subglacial topography of Antarctica | 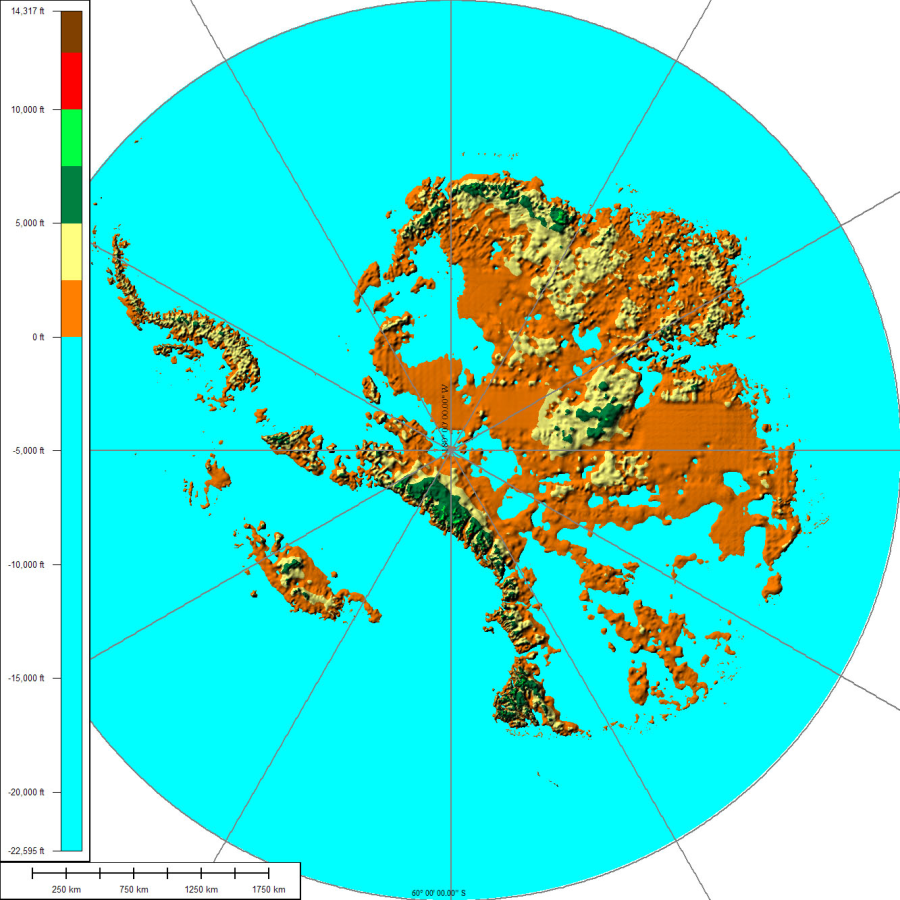
The above map shows the subglacial topography of Antarctica. As indicated by the scale on left-hand side, blue represents portion of Antarctica lying below sea level. The other colors indicate Antarctic bedrock lying above sea level. Each color represents an interval of 2,500 ft (760 m) in elevation. Map is not corrected for sea level rise or isostatic rebound, which would occur if the Antarctic ice sheet completely melted to expose the bedrock surface. | The icing of Antarctica began with ice-rafting from middle Eocene times about 45.5 million years ago[5] and escalated inland widely during the Eocene–Oligocene extinction event about 34 million years ago. CO2 levels were then about 760 ppm[6] and had been decreasing from earlier levels in the thousands of ppm. Carbon dioxide decrease, with a tipping point of 600 ppm, was the primary agent forcing Antarctic glaciation.[7] The glaciation was favored by an interval when the Earth's orbit favored cool summers but Oxygen isotope ratio cycle marker changes were too large to be explained by Antarctic ice-sheet growth alone indicating an ice age of some size.[8] The opening of the Drake Passage may have played a role as well[9] though models of the changes suggest declining CO2 levels to have been more important.[10] | | | Source: Wikipedia | | URL: http://en.wikipedia.org/wiki/Antarctic_ice_sheet |
| West Antarctic glaciers are collapsing, and it's "unstoppable" | 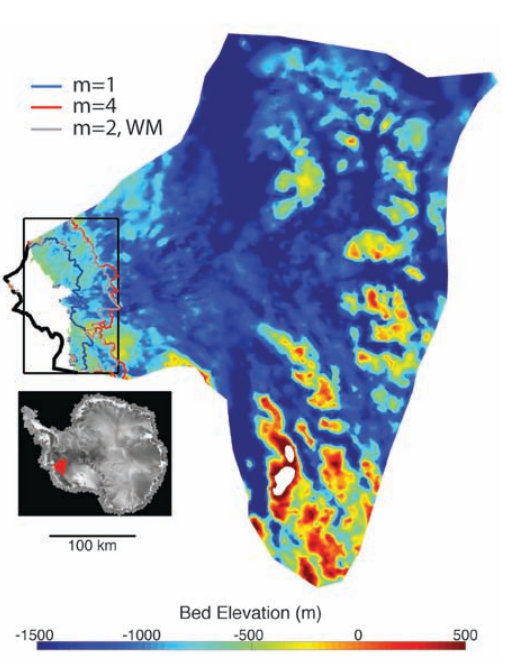
Radar image showing the ice-shelf edge of the Thwaites glacier in West Antarctica (thick black line) and the position of the "grounding line" - where ice meets ocean and goes afloat - under a high warming scenario (red line). Source: Joughin et al,. (2014) | Eye-catching words like "collapse", "irreversible", "unstoppable" and "catastrophic" peppered media coverage last week of two papers charting the demise of West Antarctic glaciers.
The first paper in Science looked at how changes in wind and ocean circulations are bringing warm water in contact with the underside of the Thwaites glacier - one of the biggest in West Antarctica - melting it from the bottom up. Similar things are happening with other glaciers across West Antarctica, explained the second paper in Geophysical Research Letters.
Not only are the glaciers shrinking, but there's nothing to stop them melting completely. That's why scientists are talking about the glaciers' collapse as "irreversible" and "unstoppable".
And without the huge glaciers to prop up the interior of the ice sheet, much larger areas of West Antarctic ice will start slipping into the ocean. This would ultimately raise sea levels by three to four metres, though that would take several centuries, say the scientists.
Here are some key questions on both bits of research answered by experts. | | | Source: carbonbrief | URL: http://www.carbonbrief.org/blog/2014/05/ice-picks-five-pieces-of-ice-news-revealing-earth%E2%80%99s-ice-cover-is-in-serious-decline/
(The text for the image(s) on this Web page was taken from the above source.) |
| National Academy of Sciences - Climate Change: Evidence and Causes | | Why is Arctic sea ice decreasing while Antarctic sea ice is not? | 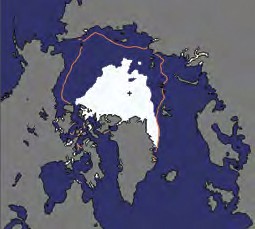
Figure 5. The Arctic summer
sea ice extent in 2012, (measured
in September) was a record low,
shown (in white) compared to the
median summer sea ice extent for
1979 to 2000 (in orange outline). In
2013, Arctic summer sea ice extent
rebounded somewhat, but was still
the sixth smallest extent on record.
Source: National Snow and Ice Data
Center | Sea ice extent is affected by winds and ocean currents as well as temperature. Sea ice
in the partly-enclosed Arctic Ocean seems to be responding directly to warming, while
changes in winds and in the ocean seem to be dominating the patterns of climate and sea
ice change in the ocean around Antarctica. Sea ice in the Arctic has decreased dramatically since the late 1970s, particularly in summer and autumn.
Since the satellite record began in 1978 (providing for the first time a complete and continuous areal
coverage of the Arctic), the yearly minimum Arctic sea ice extent (which occurs in early to mid-September)
has decreased by more than 40% [Figure 5]. Ice cover expands again each Arctic winter but the ice is
thinner than it used to be. Estimates of past sea ice extent suggest that this decline may be unprecedented
in at least the past 1,450 years. The total volume of ice, the product of ice thickness and area, has
decreased faster than ice extent over the past decades. Because sea ice is highly reflective, warming is
amplified as the ice decreases and more sunshine is absorbed by the darker underlying ocean surface.
Sea ice in the Antarctic has shown a slight increase in extent since 1979 overall, although some areas,
such as that to the west of the Antarctic Peninsula, have experienced a decrease. Changes in surface
wind patterns around the continent have contributed to the Antarctic pattern of sea ice change while
ocean factors such as the addition of cool fresh water from melting ice shelves may also have played a
role. The wind changes include a recent strengthening of westerly winds, which reduces the amount of
warm air from low latitudes penetrating into the southern high latitudes and alters the way in which ice
moves away from the continent. The change in winds may result in part from the effects of stratospheric
ozone depletion over Antarctica (i.e., the ozone hole, a phenomenon that is distinct from the humandriven
changes in long-lived
greenhouse gases discussed in
this document). However, shortterm
trends in the Southern
Ocean, such as those observed,
can readily occur from natural
variability of the atmosphere,
ocean and sea ice system. | | | Source: NAS | URL: http://dels.nas.edu/resources/static-assets/exec-office-other/climate-change-QA.pdf
(The text for the image(s) on this Web page was taken from the above source.) |
|
|