Weather
This Fact Page displays text and images related to global warming and climate change
(Hover your mouse over the text below to "popup" a window with a related text.
Click on the text or image to open a new window with a detailed description.)
|
|
| National Academy of Sciences - Climate Change: Evidence and Causes | | Does the rate of warming vary from one decade to another? | 
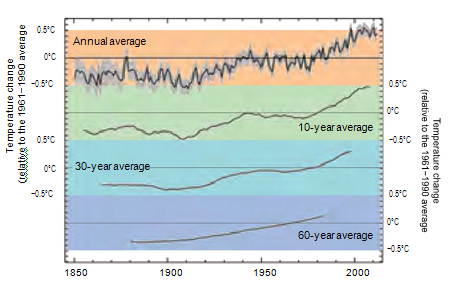
figure 4. As the climate system
varies naturally from year to year
and from decade to decade, reliable
inferences about human-induced
climate change must be made with
a longer view, using multi-decadal
and longer records. Calculating a
‘running average’ over these longer
timescales allows one to more easily
see long-term trends. For the global
average temperature for the period
1850-2012 (using the data from
the UK Met Office Hadley Centre
relative to the 1961-90 average) the
plots show: (top) the average and
range of uncertainty for annually
averaged data; (2nd plot) the
temperature given for any date is
the average for the ten years about
that date; (3rd plot) the equivalent
picture for 30-year; and (4th plot)
the 60-year averages. Source: Met
Office, based on the HadCRUT4 dataset
from the Met Office and Climatic
Research Unit (Morice et al., 2012). | Yes. The observed warming rate has varied from year to year, decade to decade, and place
to place, as is expected from our understanding of the climate system. These shorterterm
variations are mostly due to natural causes, and do not contradict our fundamental
understanding that the long-term warming trend is primarily due to human-induced
changes in the atmospheric levels of CO2 and other greenhouse gases. Even as CO2 is rising steadily in the atmosphere, leading to gradual warming of Earth’s surface, many natural
factors are modulating this long-term warming. Large volcanic eruptions increase the number of small
particles in the stratosphere that reflect sunlight, leading to short-term surface cooling lasting typically two
to three years, followed by a slow recovery. Ocean circulation and mixing vary naturally on many time scales,
causing variations in sea surface temperatures as well as changes in the rate at which heat is transported to
greater depths. For example, the tropical Pacific swings between warm El Niño and cooler La Niña events
on timescales of two to seven years. Scientists know of and study many different types of climate variations,
such as those on decadal and multi-decadal timescales in the Pacific and North Atlantic Oceans, each with
its own unique characteristics. These oceanic variations are associated with significant regional and global
shifts in temperature and rainfall patterns that are evident in the observations.
Warming from decade to decade can also be affected by human factors such as variations in the emissions,
from coal-fired power plants and other pollution sources, of greenhouse gases and of aerosols (airborne
particles that can have both warming and cooling effects).
These variations in the temperature trend are clearly evident in the observed temperature record [Figure
4]. Short-term natural climate variations could also affect the long-term human-induced climate change
signal and vice-versa, because climate variations on different space and timescales can interact with
one another. It is partly for this reason that climate change projections are made using climate models
(see infobox, p.20) that can account for many different types of climate variations and their interactions.
Reliable inferences about human-induced climate change must be made with a longer view, using records
that cover many decades. | | | Source: NAS | URL: http://dels.nas.edu/resources/static-assets/exec-office-other/climate-change-QA.pdf
(The text for the image(s) on this Web page was taken from the above source.) |
| National Academy of Sciences - Climate Change: Evidence and Causes | | If the world is warming, why are some winters and summers still very cold? | | Global warming is a long-term trend, but that does not mean that every year will be
warmer than the previous one. Day to day and year to year changes in weather patterns
will continue to produce some unusually cold days and nights, and winters and summers,
even as the climate warms. Climate change means not only changes in globally averaged surface temperature, but also changes in
atmospheric circulation, in the size and patterns of natural climate variations, and in local weather. La
Niña events shift weather patterns so that some regions are made wetter, and wet summers are generally
cooler. Stronger winds from polar regions can contribute to an occasional colder winter. In a similar way,
the persistence of one phase of an atmospheric circulation pattern known as the North Atlantic Oscillation
has contributed to several recent cold winters in Europe, eastern North America, and northern Asia.
Atmospheric and ocean circulation patterns will evolve as Earth warms and will influence storm tracks
and many other aspects of the weather. Global warming tilts the odds in favour of more warm days and
seasons and fewer cold days and seasons. For example, across the continental United States in the 1960s
there were more daily record low temperatures than record highs, but in the 2000s there were more than
twice as many record highs as record lows. Another important example of tilting the odds is that over
recent decades heatwaves have increased in frequency in large parts of Europe, Asia and Australia. | | | Source: NAS | URL: http://dels.nas.edu/resources/static-assets/exec-office-other/climate-change-QA.pdf
(The text for the image(s) on this Web page was taken from the above source.) |
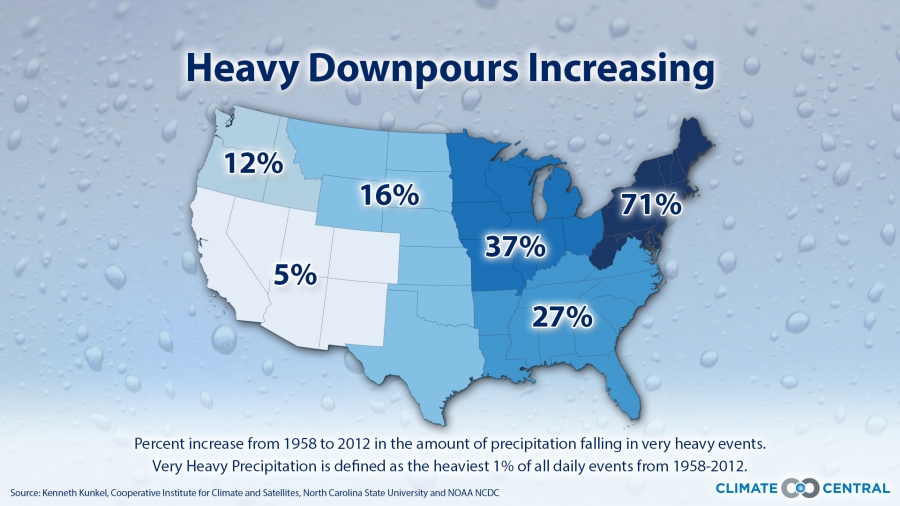
| Increase in Extreme Precipitation Events 1958-2012 | | The warmer atmosphere holds more water (about 4% per degree F) and a likely result has been be the increase in severe precipitation events in the last 50 years in the United States |  | If you get the feeling that heavy downpours are more intense than they used to be, you’re not imagining it. According to the National Climate Assessment, the most extreme precipitation events (those in the 99th percentile of intensity) have increased in every region of the contiguous states since the 1950s. As the map above shows, the rise in intensity has been greatest in the Northeast and least in the Southwest — and in all cases, climate scientists believe, the reason is simple: in a world warmed by heat-trapping greenhouse gases, there’s more evaporation, and the atmosphere can hold on to more water. And when that water vapor condenses as rain or snow, there’s more of it. | | | Source: climatecentral | URL: https://www.climatecentral.org/gallery/maps/extreme-precipitation-events-are-on-the-rise
(The text for the image(s) on this Web page was taken from the above source.) |
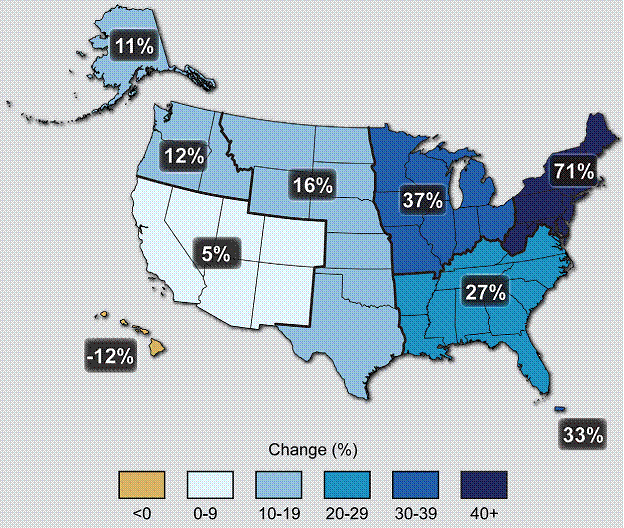
| Observed Change in Very Heavy Precipitation | 
Percent changes in the amount of precipitation falling in very heavy events (the heaviest 1%) from 1958 to 2012 for each region. There is a clear national trend toward a greater amount of precipitation being concentrated in very heavy events, particularly in the Northeast and Midwest. (Figure source: updated from Karl et al. 2009c ). | According to Rob Moore, a water and climate expert at the Natural Resources Defense Council, 25 percent of flood damages in the country stem from heavy rainfall overwhelming stormwater systems, rather than flooding we normally associate with rivers rising over their banks. | | | Source: National Climate Assessment | | URL: http://s3.amazonaws.com/nca2014/high/NCA3_Climate_Change_Impacts_in_the_United%20States_HighRes.pdf? |
|
|