Carbon Dioxide
This Fact Page displays text and images related to global warming and climate change
(Hover your mouse over the text below to "popup" a window with a related text.
Click on the text or image to open a new window with a detailed description.)
|
|
| CO2 Concentrations Last 800,000 Years | | The atmospheric concentration of CO2 is continuing to increase at about 3.2ppm/year, having surpassed 400ppm for several months in 2014. | 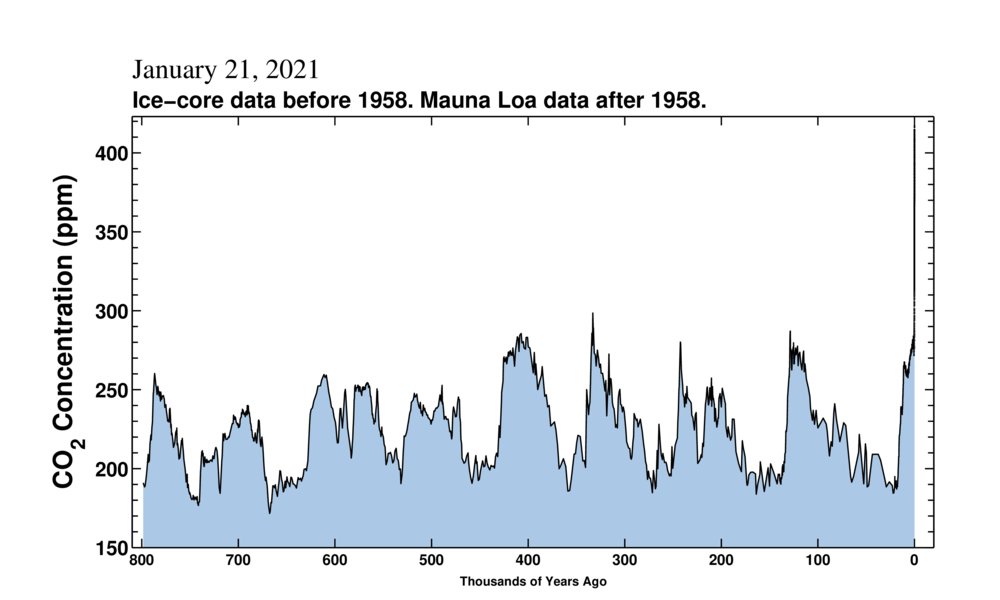 | | | Source: Scripts | | URL: http://keelingcurve.ucsd.edu/ |
| | CO2 Concentrations Since 1700 |  | | | Source: Scripts | | URL: http://keelingcurve.ucsd.edu/ |
| National Academy of Sciences - Climate Change: Evidence and Causes | | CO2 is already in the atmosphere naturally, so why are emissions from human activity significant? | | Human activities have significantly disturbed the natural carbon cycle by extracting longburied
fossil fuels and burning them for energy, thus releasing CO2 to the atmosphere. In nature, CO2 is exchanged continually between the atmosphere, plants and animals through
photosynthesis, respiration, and decomposition, and between the atmosphere and ocean through gas
exchange. A very small amount of CO2 (roughly 1% of the emission rate from fossil fuel combustion) is
also emitted in volcanic eruptions. This is balanced by an equivalent amount that is removed by chemical
weathering of rocks.
The CO2 level in 2012 was about 40% higher than it was in the nineteenth century. Most of this CO2
increase has taken place since 1970, about the time when global energy consumption accelerated.
Measured decreases in the fraction of other forms of carbon (the isotopes 14C and 13C) and a small
decrease in atmospheric oxygen concentration (observations of which have been available since 1990)
show that the rise in CO2 is largely from combustion of fossil fuels (which have low 13C fractions and no
14C). Deforestation and other land use changes have also released carbon from the biosphere (living
world) where it normally resides for decades to centuries. The additional CO2 from fossil fuel burning and
deforestation has disturbed the balance of the carbon cycle, because the natural processes that could
restore the balance are too slow compared to the rates at which human activities are adding CO2 to the
atmosphere. As a result, a substantial fraction of the CO2 emitted from human activities accumulates
in the atmosphere, where some of it will remain not just for decades or centuries, but for thousands of
years. Comparison with the CO2 levels measured in air extracted from ice cores indicates that the current
concentrations are higher than they have been in at least 800,000 years (see Question 6). | | | Source: NAS | URL: http://dels.nas.edu/resources/static-assets/exec-office-other/climate-change-QA.pdf
(The text for the image(s) on this Web page was taken from the above source.) |
| Cross-plot of estimates of atmospheric CO2 and coinciding sea level | 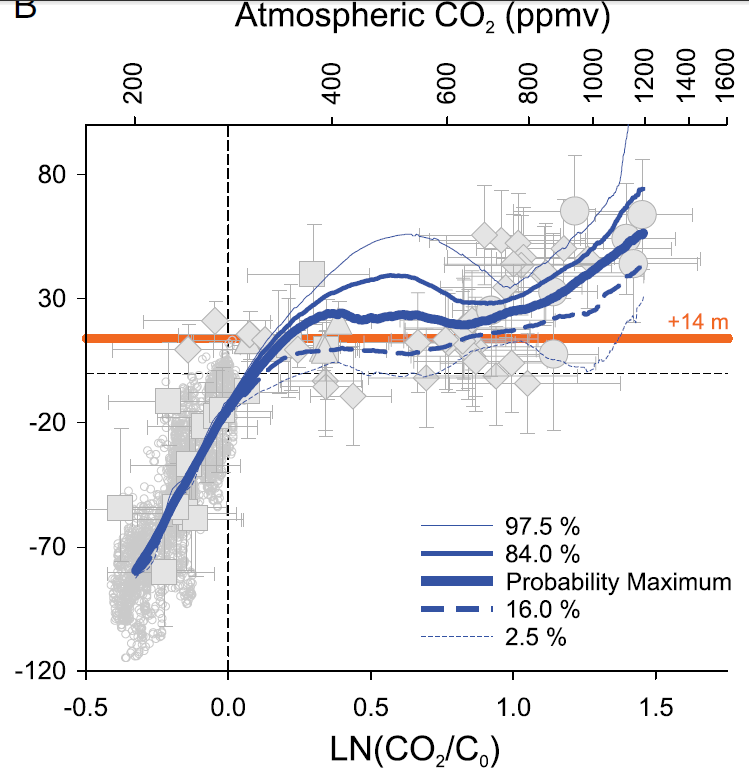
Cross-plot of estimates of atmospheric CO2 and coinciding sea level… (B) Results from our probabilistic analysis of the data that fully accounts for uncertainty in both X and Y parameters … dotted lines denote the preindustrial conditions of 0 m and 280 ppm CO2. The horizontal orange line shows +14 m, which is the sea-level rise associated with the total melting of WAIS and GrIS (31). (WAIS= West Antarctic Ice Sheet, GrIS=Greenland Ice Sheet) Source: “Relationship between sea level and climate forcing by CO2 on geological timescales”, Gavin L. Foster and Eelco J. Rohling, Sept 2012 - | | | Source: PNAS | | URL: http://www.pnas.org/content/110/4/1209.figures-only |
| GHG Concentration Stabilization Level vs Average Temperature Increase | 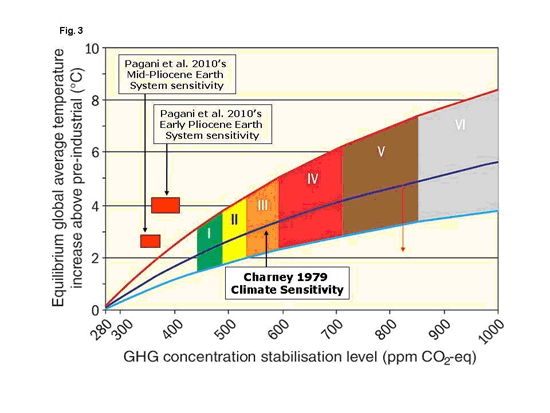
Equilibrium global average temperature increase above pre-industrial (oC) vs greenhouse gas concentration stabilization level (ppm CO2-eq). Plot represents Charney’s (1979) climate sensitivity relation of 3±1.5oC and red squares regions of Pagani et al.’s (2010) early and mid-Pliocene climate sensitivity relations. Colored zones I to VI represent various CO2 stabilization targets | “Charney 1979 Climate Senstivity” is about 3oC for a doubling of CO2. The range shown is for climate sensitivities of 1.5 to 4.5. | | | Source: http://joannenova.com.au/ | | URL: http://joannenova.com.au/2010/05/debate-part-5-the-planetary-atmosphere-and-climate-change/ |
| Global CO2 Emissions - Projected vs Actual (through 2014) | | If we continue emitting CO2 at the current accelerating rate the result will very likely be a climate that is inhospitable to civilization as we know it | 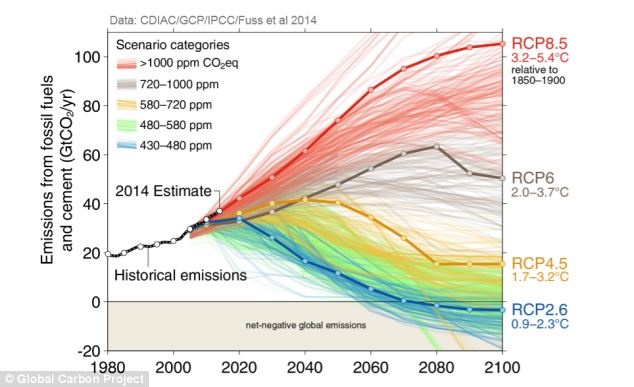
Worst Case Carbon Dioxide Emissions Increases Continue — Hitting 40 Billion Tons Per Year in 2013 | (Global carbon emissions continued along a worst-case track during 2013. Note that estimated temperature increases are for this century only. For context, it took 12,000 years for the world to warm 5 degrees Celsius at the end of the last ice age. Image source: Global Carbon Project.)
On the current track, global CO2 emissions will double in about 30 years. This pace of emissions increase is along the worst-case path projected by the UN’s IPCC. One that will hit 8.5 watts per meter squared of additional warming at the top of the Earth’s atmosphere and greater than 1,000 ppm CO2 equivalent greenhouse gas heat forcing by the end of this century.
Such a massive increase from human sources does not include amplifying feedback emissions from global methane or CO2 stores such as those now apparently destabilizing in the Arctic. Such emissions could add an additional 20 to 30 percent or greater heat forcing on top of the human forcing, according to scientific estimates, by the end of this century.
The massive blow would be more than enough to trigger a hothouse extinction event — one that could well rival or exceed the Permian (also known as ‘the great dying’) in its ferocity due to the very rapid pace of the human heat accumulation. | | URL: http://robertscribbler.wordpress.com/2014/09/22/worst-case-carbon-dioxide-emissions-increases-continue-hitting-40-billion-tons-per-year-in-2013/
(The text for the image(s) on this Web page was taken from the above source.) |
| Global Temperature and Carbon Dioxide - 1880-2012 | 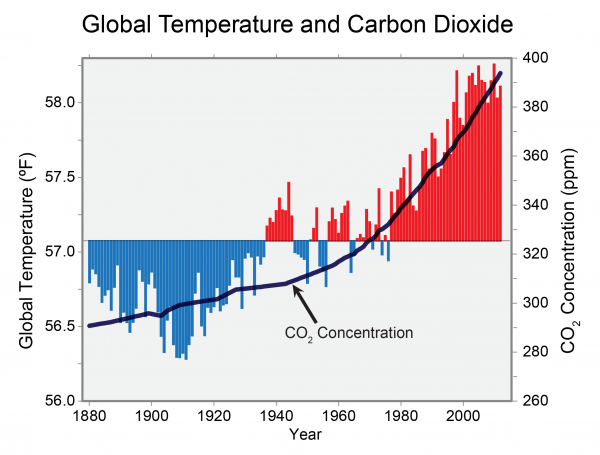
The Global Surface Temperature is Rising
Global annual average temperature measured over land and oceans. Red bars indicate temperatures above and blue bars indicate temperatures below the 1901-2000 average temperature. The black line shows atmospheric carbon dioxide concentration in parts per million. | Global average temperature is one of the most-cited indicators of global climate change, and shows an increase of approximately 1.4°F since the early 20th Century. The global surface temperature is based on air temperature data over land and sea-surface temperatures observed from ships, buoys and satellites. There is a clear long-term global warming trend, while each individual year does not always show a temperature increase relative to the previous year, and some years show greater changes than others. These year-to-year fluctuations in temperature are due to natural processes, such as the effects of El Ninos, La Ninas, and the eruption of large volcanoes. Notably, the 20 warmest years have all occurred since 1981, and the 10 warmest have all occurred in the past 12 years. | | | Source: NOAA | URL: https://www.globalchange.gov/
(The text for the image(s) on this Web page was taken from the above source.) |
| National Academy of Sciences - Climate Change: Evidence and Causes | | If emissions of greenhouse gases were stopped, would the climate return to the conditions of 200 years ago? | 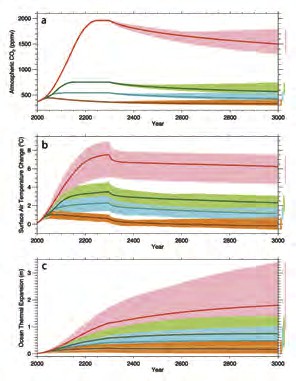
figure 9. If global emissions
were to suddenly stop, it would
take a long time for surface air
temperatures and the ocean to
begin to cool, because the excess
CO2 in the atmosphere would
remain there for a long time and
would continue to exert a warming
effect. Model projections show how
atmospheric CO2 concentration
(a), surface air temperature (b),
and ocean thermal expansion (c)
would respond following a scenario
of business-as-usual emissions
ceasing in 2300 (red), a scenario
of aggressive emission reductions,
falling close to zero 50 years from
now (orange), and two intermediate
emissions scenarios (green and
blue). The small downward tick
in temperature at 2300 is caused
by the elimination of emissions
of short-lived greenhouse gases,
including methane. Source: Zickfeld
et al., 2013 | No. Even if emissions of greenhouse gases were to suddenly stop, Earth’s surface temperature
would not cool and return to the level in the pre-industrial era for thousands of years. If emissions of CO2 stopped altogether, it would take many thousands of years for atmospheric CO2 to
return to ‘pre-industrial’ levels due to its very slow transfer to the deep ocean and ultimate burial in ocean
sediments. Surface temperatures would stay elevated for at least a thousand years, implying extremely
long-term commitment to a warmer planet due to past and current emissions, and sea level would likely
continue to rise for many centuries even after temperature stopped increasing [Figure 9]. Significant
cooling would be required to reverse melting of glaciers and the Greenland ice sheet, which formed
during past cold climates. The current CO2-induced warming of Earth is therefore essentially irreversible
on human timescales. The amount and rate of further warming will depend almost entirely on how much
more CO2 humankind emits. | | | Source: NAS | URL: http://dels.nas.edu/resources/static-assets/exec-office-other/climate-change-QA.pdf
(The text for the image(s) on this Web page was taken from the above source.) |
| National Academy of Sciences - Climate Change: Evidence and Causes | | Is the current level of atmospheric CO2 concentration unprecedented in Earth’s history? | 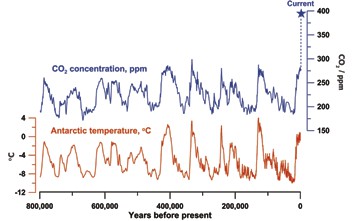
Figure 3. Data from ice cores have
been used to reconstruct Antarctic
temperatures and atmospheric
CO2 concentrations over the past
800,000 years. Temperature is
based on measurements of the
isotopic content of water in the
Dome C ice core. CO2 is measured
in air trapped in ice, and is a
composite of the Dome C and
Vostok ice core. The current CO2
concentration (blue star) is from
atmospheric measurements. The
cyclical pattern of temperature
variations constitutes the ice
age/ interglacial cycles. During
these cycles, changes in CO2
concentrations (in blue) track
closely with changes in temperature
(in red). As the record shows, the
recent increase in atmospheric CO2
concentration is unprecedented
in the past 800,000 years. Source:
Figure by Jeremy Shakun, data from
Lüthi et al., 2008 and Jouzel et al., 2007. | The present level of atmospheric CO2 concentration is almost certainly unprecedented
in the past million years, during which time modern humans evolved and societies
developed. The atmospheric CO2 concentration was however higher in Earth’s more
distant past (many millions of years ago), at which time palaeoclimatic and geological
data indicate that temperatures and sea levels were also higher than they are today. Measurements of air in ice cores show that for the past 800,000 years up until the 20th century, the
atmospheric CO2 concentration stayed within the range 170 to 300 parts per million (ppm), making the recent
rapid rise to nearly 400 ppm over 200 years particularly remarkable [figure 3]. During the glacial cycles of
the past 800,000 years both CO2 and methane have acted as important amplifiers of the climate changes
triggered by variations in Earth’s orbit around the Sun. As Earth warmed from the last ice age, temperature and CO2 started to rise at approximately the same time and continued to rise in tandem from about 18,000 to
11,000 years ago. Changes in ocean temperature, circulation, chemistry and biology caused CO2 to be released
to the atmosphere, which combined with other feedbacks to push Earth into an even warmer state.
For earlier geological times, CO2 concentrations and temperatures have been inferred from less direct
methods. Those suggest that the concentration of CO2 last approached 400 ppm about 3 to 5 million
years ago, a period when global average surface temperature is estimated to have been about 2 to 3.5°C
higher than in the pre-industrial period. At 50 million years ago, CO2 may have reached 1000 ppm, and
global average temperature was probably about 10°C warmer than today. Under those conditions, Earth
had little ice, and sea level was at least 60 metres higher than current levels. | | | Source: NAS | URL: http://dels.nas.edu/resources/static-assets/exec-office-other/climate-change-QA.pdf
(The text for the image(s) on this Web page was taken from the above source.) |
| National Academy of Sciences - Climate Change: Evidence and Causes | | Is there a point at which adding more CO2 will not cause further warming? | | No. Adding more CO2 to the atmosphere will cause surface temperatures to continue to
increase. As the atmospheric concentrations of CO2 increase, the addition of extra CO2
becomes progressively less effective at trapping Earth’s energy, but surface temperature
will still rise. Our understanding of the physics by which CO2 affects Earth’s energy balance is confirmed by laboratory
measurements, as well as by detailed satellite and surface observations of the emission and absorption
of infrared energy by the atmosphere. Greenhouse gases absorb some of the infrared energy that Earth
emits in so-called bands of stronger absorption that occur at certain wavelengths. Different gases absorb
energy at different wavelengths. CO2 has its strongest heat-trapping band centred at a wavelength of 15
micrometres (millionths of a metre), with wings that spread out a few micrometres on either side. There
are also many weaker absorption bands. As CO2 concentrations increase, the absorption at the centre of
the strong band is already so intense that it plays little role in causing additional warming. However, more
energy is absorbed in the weaker bands and in the wings of the strong band, causing the surface and
lower atmosphere to warm further. | | | Source: NAS | URL: http://dels.nas.edu/resources/static-assets/exec-office-other/climate-change-QA.pdf
(The text for the image(s) on this Web page was taken from the above source.) |
|
|