Arctic
This Fact Page displays text and images related to global warming and climate change
(Hover your mouse over the text below to "popup" a window with a related text.
Click on the text or image to open a new window with a detailed description.)
|
|
| | | | | | | | | | Arctic Ice Volume in September - 1979-2013As a result of the of the increased Arctic temperatures, the Arctic Ocean is losing very significant amounts of summertime ice volume (ice volume is a better indicator of the melting of the ice in summertime than ice area) 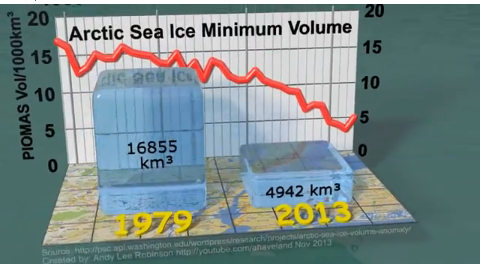 | | | | | | | | | | | | | | | | | | | | | | | | | | | | | | | | | Carbon from permafrost soils could add as much as 0.4ºF to 0.6ºF of warming by 2100Permafrost temperatures are increasing over Alaska and much of the Arctic. Regions of discontinuous permafrost in interior Alaska (where annual average soil temperatures are already close to 32°F) are highly vulnerable to thaw. Thawing permafrost releases carbon dioxide and methane – heat-trapping gases that contribute to even more warming. Recent estimates suggest that the potential release of carbon from permafrost soils could add as much as 0.4ºF to 0.6ºF of warming by 2100.150 Methane emissions have been detected from Alaskan lakes underlain by permafrost, 151 and measurements suggest potentially even greater releases from thawing methane hydrates in the Arctic continental shelf of the East Siberian Sea.152 However, the response times of Arctic methane hydrates to climate change are quite long relative to methane’s lifetime in the atmosphere (about a decade).153 More generally, the importance of Arctic methane sources relative to other methane sources, such as wetlands in warmer climates, is largely unknown. The potential for a self-reinforcing feedback between permafrost thawing and additional warming contributes additional uncertainty to the high end of the range of future warming. The projections of future climate shown throughout this report do not include the additional increase in temperature associated with this thawing. | | Projected Arctic Sea Ice DeclineThe IPCC has really underestimated when the summer-time Arctic ocean will likely become ice, so it’s temperature estimates are likely low 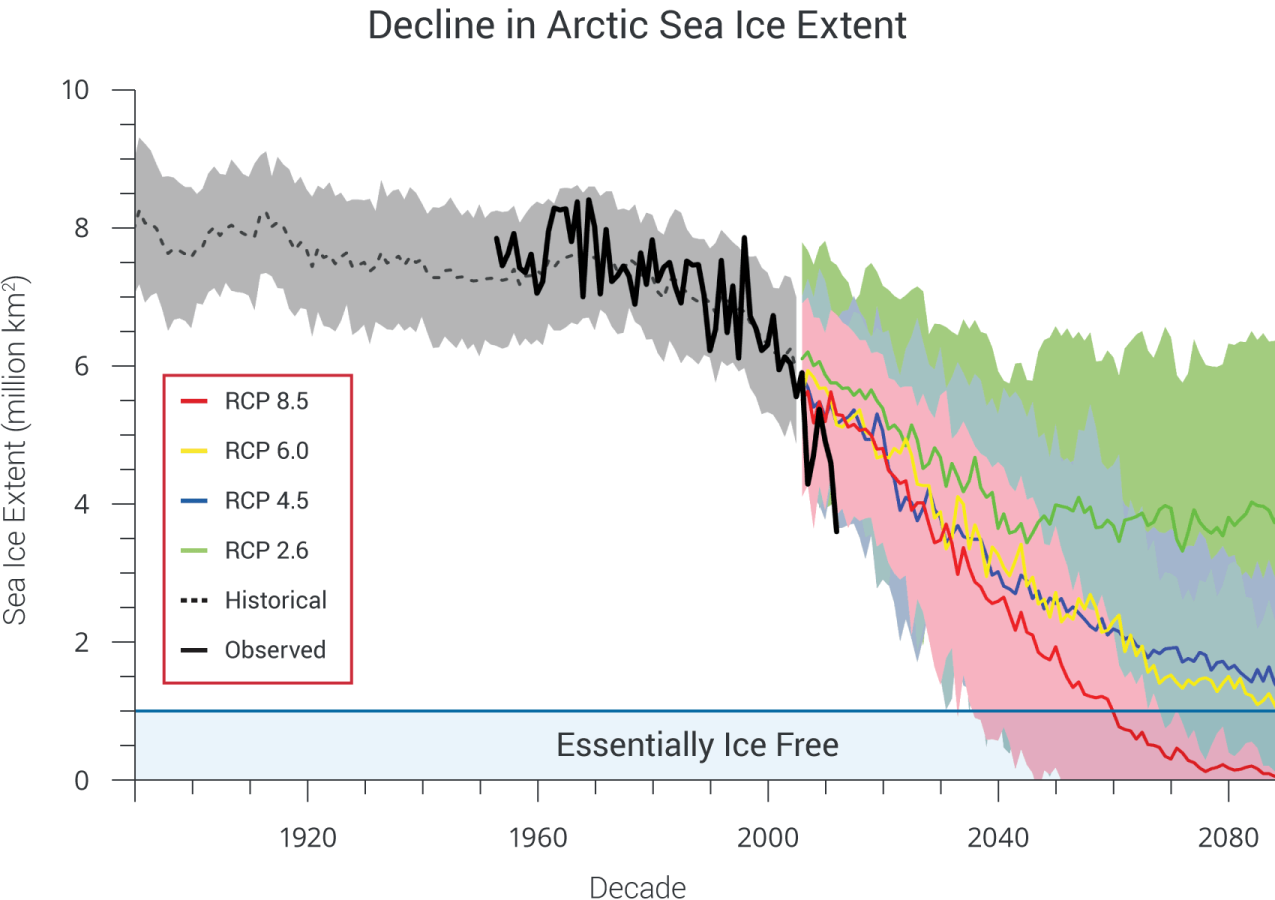 | | | | | | | |
| Arctic and Global Temperature Anomoly | 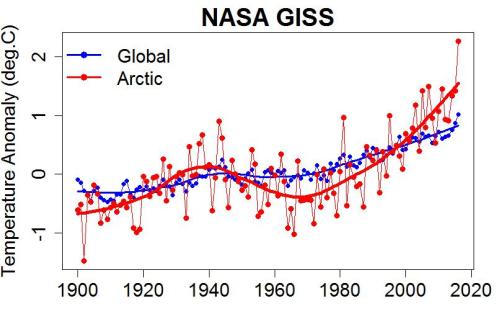 | But — not all parts of it are heating up at the same rate. Temperature in the Arctic in particular is rising faster than the global average. The Arctic, according to NASA data, warmed by about 2.2 °C (4 °F) between 1900 and 2015. | | | Source: Tamino | | URL: https://tamino.wordpress.com/2016/12/14/arctic/ |
| Arctic and Global Temperature Anomoly - Cowtan & Way | 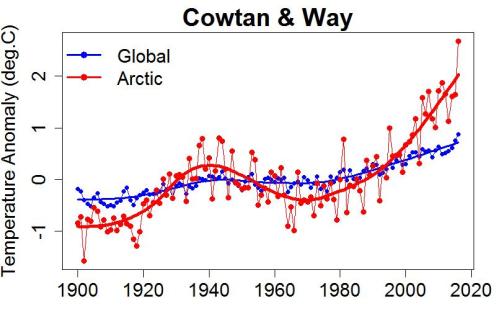 | Their estimate of Arctic heating is considerably bigger than NASA's. It indicates that between 1900 and 2015, Arctic temperature has risen about 2.9 °C (5.3 °F). | | | Source: Tamino | | URL: https://tamino.wordpress.com/2016/12/14/arctic/ |
| Arctic Ice Volume in September - 1979-2013 | | As a result of the of the increased Arctic temperatures, the Arctic Ocean is losing very significant amounts of summertime ice volume (ice volume is a better indicator of the melting of the ice in summertime than ice area) | 
Artic sea ice volume has dropped far faster than coverage. In September the ice that remains is down by nearly 80% from its volume in 1980. At current pace of volume loss, the first ice-free Arctic day could come in just a few years. | Sea ice volume is a measurement of ice extent and its thickness. Understanding how fast the ice is being depleted by volume is crucial to working out how quickly we are approaching an ice-free Arctic summertime because thinner ice can be more vulnerable to future melting. As one expert noted, “there comes a point when large parts of the ice pack become so thin that it doesn't matter what the weather does…the train keeps chugging along, even when the weather isn't so great for melt”.
As with sea ice extent, volume appears to be in sharp decline in the Arctic. Although ice volume naturally increases and decreases during the seasons, scientists using the Pan-Arctic Ice Ocean Modelling and Assimilation System (PIOMAS) have identified that the amount of ice has been steadily falling since the 1970s.
In addition, the link between disappearing ice and temperature in modern times is now becoming much clearer. NOAA has said that the Arctic “has reached a new state…characterised by less sea ice (both extent and thickness),” adding that “the decline in total sea ice extent has been accompanied by an unprecedented loss of old, thick multiyear ice.”Or, as one commentator noted, Arctic sea ice loss is now “being driven by human emissions.Click here for the source | | | Source: ClimateState | | URL: http://climatestate.com/2013/11/22/arctic-sea-ice-minimum-volumes-1979-2013/ |
| Arctic Sea Ice Extent Ananoly - Nov 2016 | 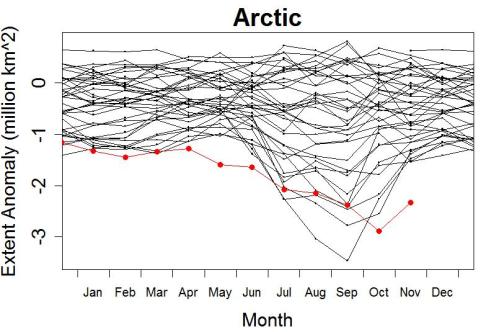 | The extremity of the last couple of months might be even more visible in a plot of monthly average sea ice anomaly (the difference between the month's value, and what's “typical” for that month of the year) | | | Source: Tamino | | URL: https://tamino.wordpress.com/2016/12/14/arctic/ |
| Artcic sea ice extent for the last 1,450 years | 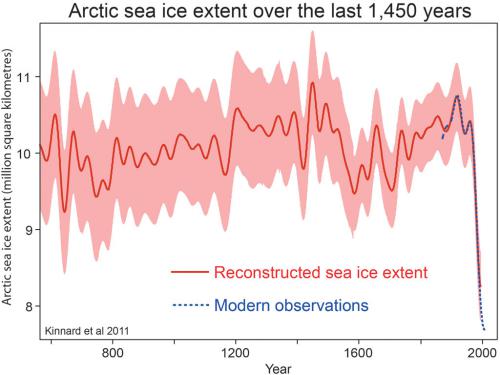
Reconstructed Arctic sea ice extent over the past 1,450 years, from Kinnard et al. (2011). | Although more Arctic sea ice survived this year [2014] than in the record-shattering melt of 2012, in 2014 the ice was nevertheless at its 6th-lowest level in thousands of years. About 70% of the sea ice in the Arctic has disappeared over the past three decades, mainly due to human-caused global warming. This rapid decline is well outside “the normal range” of Arctic sea ice extent and volume. | | | Source: Sceptical Science | | URL: http://www.skepticalscience.com/weather-channel-john-coleman-prefers-conspiracies-to-science.html |
| Artcic Sea Ice Extent Through Nov 2016 | 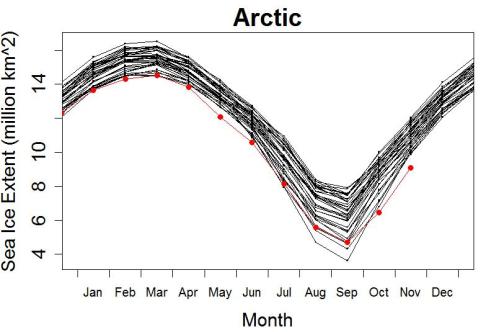 | More heat generally means less ice. This is rather obvious in the Arctic lately, as 6 out of 10 months so far this year have set new record lows for the extent of sea ice (2016 values shown in red) | | | Source: Tamino | | URL: https://tamino.wordpress.com/2016/12/14/arctic/ |
| Carbon from permafrost soils could add as much as 0.4ºF to 0.6ºF of warming by 2100 | | Permafrost temperatures are increasing over Alaska and much of the Arctic. Regions of discontinuous permafrost in interior Alaska (where annual average soil temperatures are already close to 32°F) are highly vulnerable to thaw. Thawing permafrost releases carbon dioxide and methane – heat-trapping gases that contribute to even more warming. Recent estimates suggest that the potential release of carbon from permafrost soils could add as much as 0.4ºF to 0.6ºF of warming by 2100.150 Methane emissions have been detected from Alaskan lakes underlain by permafrost, 151 and measurements suggest potentially even greater releases from thawing methane hydrates in the Arctic continental shelf of the East Siberian Sea.152 However, the response times of Arctic methane hydrates to climate change are quite long relative to methane’s lifetime in the atmosphere (about a decade).153 More generally, the importance of Arctic methane sources relative to other methane sources, such as wetlands in warmer climates, is largely unknown. The potential for a self-reinforcing feedback between permafrost thawing and additional warming contributes additional uncertainty to the high end of the range of future warming. The projections of future climate shown throughout this report do not include the additional increase in temperature associated with this thawing. | | | Source: National Climate Assessment | | URL: http://nca2014.globalchange.gov/report/our-changing-climate/melting-ice |
| Projected Arctic Sea Ice Decline | | The IPCC has really underestimated when the summer-time Arctic ocean will likely become ice, so it’s temperature estimates are likely low |  | Figure 2.29. Model simulations of Arctic sea ice extent for September (1900-2100)
based on observed concentrations of heat-trapping gases and particles (through
2005) and four scenarios. Colored lines for RCP scenarios are model averages
(CMIP5) and lighter shades of the line colors denote ranges among models for
each scenario. Dotted gray line and gray shading denotes average and range of
the historical simulations through 2005. The thick black line shows observed data
for 1953-2012. These newer model (CMIP5) simulations project more rapid sea ice
loss compared to the previous generation of models (CMIP3) under similar forcing
scenarios, although the simulated September ice losses under all scenarios still
lag the observed loss of the past decade. Extrapolation of the present observed
trend suggests an essentially ice-free Arctic in summer before mid-century.139 The
Arctic is considered essentially ice-free when the areal extent of ice is less than
one million square kilometers. (Figure source: adapted from Stroeve et al. 2012136). | | | Source: National Climate Assessment | | URL: http://data.globalchange.gov/file/6c06e9fb-29ea-41c1-acf5-c81ed0cbd831 |
| National Academy of Sciences - Climate Change: Evidence and Causes | | Why is Arctic sea ice decreasing while Antarctic sea ice is not? | 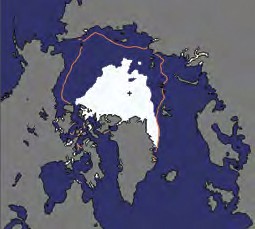
Figure 5. The Arctic summer
sea ice extent in 2012, (measured
in September) was a record low,
shown (in white) compared to the
median summer sea ice extent for
1979 to 2000 (in orange outline). In
2013, Arctic summer sea ice extent
rebounded somewhat, but was still
the sixth smallest extent on record.
Source: National Snow and Ice Data
Center | Sea ice extent is affected by winds and ocean currents as well as temperature. Sea ice
in the partly-enclosed Arctic Ocean seems to be responding directly to warming, while
changes in winds and in the ocean seem to be dominating the patterns of climate and sea
ice change in the ocean around Antarctica. Sea ice in the Arctic has decreased dramatically since the late 1970s, particularly in summer and autumn.
Since the satellite record began in 1978 (providing for the first time a complete and continuous areal
coverage of the Arctic), the yearly minimum Arctic sea ice extent (which occurs in early to mid-September)
has decreased by more than 40% [Figure 5]. Ice cover expands again each Arctic winter but the ice is
thinner than it used to be. Estimates of past sea ice extent suggest that this decline may be unprecedented
in at least the past 1,450 years. The total volume of ice, the product of ice thickness and area, has
decreased faster than ice extent over the past decades. Because sea ice is highly reflective, warming is
amplified as the ice decreases and more sunshine is absorbed by the darker underlying ocean surface.
Sea ice in the Antarctic has shown a slight increase in extent since 1979 overall, although some areas,
such as that to the west of the Antarctic Peninsula, have experienced a decrease. Changes in surface
wind patterns around the continent have contributed to the Antarctic pattern of sea ice change while
ocean factors such as the addition of cool fresh water from melting ice shelves may also have played a
role. The wind changes include a recent strengthening of westerly winds, which reduces the amount of
warm air from low latitudes penetrating into the southern high latitudes and alters the way in which ice
moves away from the continent. The change in winds may result in part from the effects of stratospheric
ozone depletion over Antarctica (i.e., the ozone hole, a phenomenon that is distinct from the humandriven
changes in long-lived
greenhouse gases discussed in
this document). However, shortterm
trends in the Southern
Ocean, such as those observed,
can readily occur from natural
variability of the atmosphere,
ocean and sea ice system. | | | Source: NAS | URL: http://dels.nas.edu/resources/static-assets/exec-office-other/climate-change-QA.pdf
(The text for the image(s) on this Web page was taken from the above source.) |
|
|