Carbon Brief
This Fact Page displays text and images related to global warming and climate change
(Hover your mouse over the text below to "popup" a window with a related text.
Click on the text or image to open a new window with a detailed description.)
|
|
Antarctic ice melt is twice as fast as ten years ago
| Antarctic ice melt is twice as fast as ten years ago | | Antarctic ice melt is twice as fast as ten years ago | 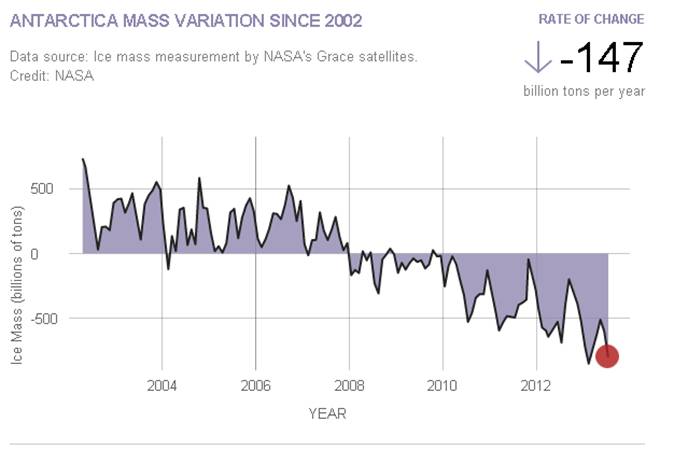
Image source: http://climate.nasa.gov/vital-signs/land-ice/ | 'Antarctic ice losses have DOUBLED in less than a decade with 159 billion tonnes of ice melting each year', reads today's Daily Mail headline. The Guardian opts for, 'Doubling of Antarctic ice loss revealed by European satellite'. The Times says 'Antarctic melt rate worries scientists'.
All three headlines stem from a paper published yesterday in Geophysical Research Letters, which finds the volume of ice melting into the ocean from Antarctica is twice as large the average between 1992 and 2011, now raising global sea levels by 0.45 millimetres a year.
The University of Leeds scientists study uses three years of data from the European Space Agency's CryoSat-2 satellite, launched in 2010. The satellite now sees five times as much area as before, totalling 96 per cent of the total Antarctic continent.
David Vaughan from the British Antarctic Survey told The Guardian why this is so important:
"Through some very clever technical improvements, [the scientists] have produced the best maps of Antarctic ice-loss we have ever had. Prediction of the rate of future global sea-level rise must be begin with a thorough understanding of current changes in the ice sheets - this study puts us exactly where we need to be."
Across Antarctica, the average height of the ice is dropping by 1.9 centimetres per year, the data shows. East Antarctica is staying roughly the same but West Antarctica is seeing big losses, where ice melt is 31 per cent faster now than between 2005 and 2011. Ice loss from glaciers along the Amundsen coast has tripled over the past two decades, the paper explains. | | | Source: carbonbrief | URL: http://www.carbonbrief.org/blog/2014/05/ice-picks-five-pieces-of-ice-news-revealing-earth%E2%80%99s-ice-cover-is-in-serious-decline/
(The text for the image(s) on this Web page was taken from the above source.) |
Global average surface temperature rise for the four RCPs
| Global average surface temperature rise for the four RCPs | 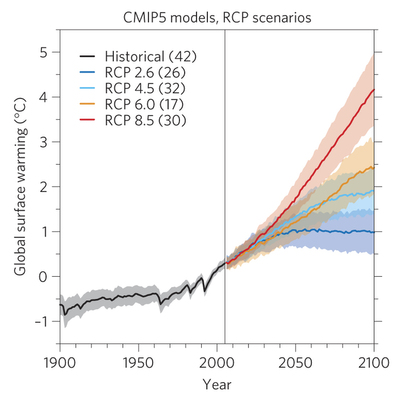
Global average surface temperature rise relative to the 1986-2005 average under new Representative Concentration Pathways. Source: Knutti & Sedlácek, 2012 | Newer studies use different types of scenarios, called Representative Concentration Pathways (RCPs), to predict future climate change. Climate models using the highest of these new concentration pathways, called RCP8.5, suggests four degrees warming as a best estimate for a world scenario where little or no mitigation action is taken. | | | Source: carbonbrief | URL: http://www.carbonbrief.org/blog/2012/11/what-is-a-4%C2%B0c-world
(The text for the image(s) on this Web page was taken from the above source.) |
IPCC Sea Level 2100 - All Scenarios
| IPCC Sea Level 2100 - All Scenarios | 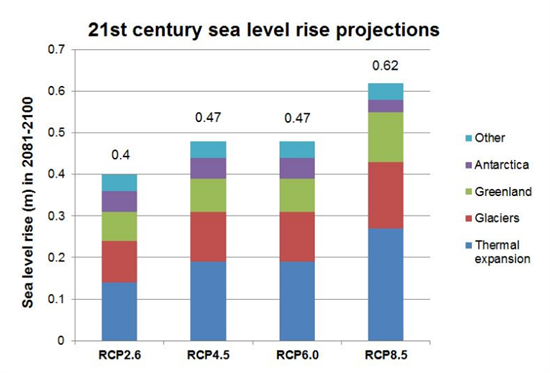
Image by Carbon Brief, created using data in Table 13.5 - Chapter 13 of the IPCC's Fifth Assessment Report. | Under all scenarios, the expansion of water as it warms is the biggest cause of sea level rise - accounting for between 30 and 55 per cent of the increase. The oceans have absorbed more than 90 per cent of the heat trapped by greenhouse gas emissions since the 1970s. As temperatures rise, more heat will enter the sea, which means water will expand further.
Glacier melt is predicted to be the next biggest contributor to future sea level rise. Glacier melting is already speeding up and almost all the world's glaciers are shrinking, says the IPCC. Under the highest emissions scenario, RCP8.5, ice loss from glaciers could drive sea levels up by as much as 16cm by the end of the century.
Melting of the Greenland ice sheet, including surface melt, is expected to be the next biggest driver of sea level rise. Like many other ice-covered regions, Greenland's ice loss is speeding up. Between 1992 and 2001 the ice sheet was losing 34 billion tonnes of ice per year, but between 2002-2011 that increased six-fold to 215 billion tonnes per year. Under the highest emissions scenario RCP8.5, Greenland's shrinking ice is expected to raise sea levels 12cm by the end of the century.
Projecting future ice loss from Antarctica is harder, as different regions of the ice sheet are changing in different ways. While solid ice is being lost from parts of the Antarctic Peninsula and in West Antarctica, the surface of the ice sheet is gaining mass as more snow falls on it. Overall, though, models predict it will cause sea levels to rise by about 5cm in most scenarios.
Higher sea levels are possible
Sea level rise of between 26 and 82 centimetres is the range the IPCC considers likely. The report doesn't rule out the possibility of higher sea levels, but says there isn't enough evidence to say what the chances are.
The likely estimates come from models that simulate all the known processes that contribute to sea level rise - and how those processes are likely to be affected if temperatures continue to rise.
Another set of models take a different approach - they look at how sea levels have changed In response to warming in the past and extend the relationship forward in time. These models give much higher projections for how much sea level rise we can expect by the end of the century - up to twice as large as the IPCC report states.
At the moment, however, there is very little agreement among this type of model. So while the new report discusses their estimates, scientists don't consider them reliable enough to include in the overall assessment. | | | Source: CarbonBrief | | URL: http://www.carbonbrief.org/blog/2013/10/what-the-new-ipcc-report-says-about-sea-level-rise/ |
Other ice caps and glaciers in the northern hemisphere are melting faster too
| Other ice caps and glaciers in the northern hemisphere are melting faster too | 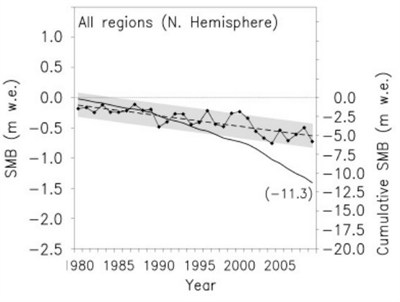
Surface mass balance of ice caps and glaciers in the northern hemisphere - excluding the Greenland Ice Sheet - showing a loss (dashed line) between 1970 and 2009. Annual values are marked by black circles. The solid black line is the cumulative ice loss over the period. Source: Mernild et al., ( 2014) | As well as the Greenland and Antarctic ice sheets, glaciers and ice caps on land are also melting under the pressure of rising temperatures and contributing to sea level rise.
A new paper published today in the Journal of Climate looks at ice-covered areas greater or equal to 0.5 square kilometres in the Northern Hemisphere, excluding the Greenland Ice Sheet.
The researchers built a model of glacier and ice cap responses to past temperature and snowfall changes, testing it against nearly 1500 measurements from 78 locations worldwide.
The scientists estimated the total contribution to sea-level rise from ice caps and glaciers was 0.51 millimetres per year between 1979-2009. But it's speeding up - looking just at the recent decade, 1999-2009, the contribution is 40 per cent higher, at around 0.71 millimetres per year. | | | Source: carbonbrief | URL: http://www.carbonbrief.org/blog/2014/05/ice-picks-five-pieces-of-ice-news-revealing-earth%E2%80%99s-ice-cover-is-in-serious-decline/
(The text for the image(s) on this Web page was taken from the above source.) |
Soot from forest fires contributed to unusually large Greenland surface melt in 2012
| Soot from forest fires contributed to unusually large Greenland surface melt in 2012 | 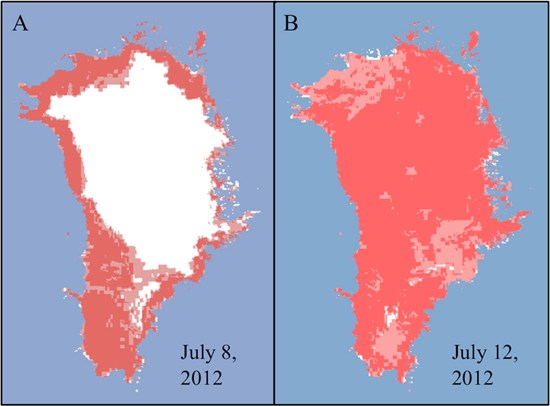
Greenland surface melt on two separate days in July 2012, the latter after high temperatures and soot from forest fires triggered widespread melting. Image courtesy of Dorothy Hall, NASA/GSFC. Source: Keegan et al., ( 2014) | Surface melting doesn't contribute to sea level rise because the water percolates back into the snow and refreezes. But it does reduce the reflectivity of the ice, known as albedo, with consequences for how much sunlight the Arctic region absorbs, and how much ice stays frozen.
Together, with soot which also decreases reflectivity, the ice albedo was pushed below a certain threshold in 1889 and 2012, making it vulnerable to rapid ice loss, say the authors. Lead author Kaitlin Keegan explains such big surface melting events won't be out of place by 2100:
"With both the frequency of forest fires and warmer temperatures predicted to increase with climate change, widespread melt events are likely to happen much more frequently in the future." | | URL: http://www.carbonbrief.org/blog/2014/05/ice-picks-five-pieces-of-ice-news-revealing-earth%E2%80%99s-ice-cover-is-in-serious-decline/
(The text for the image(s) on this Web page was taken from the above source.) |
The Greenland ice sheet could melt faster than scientists first thought
| The Greenland ice sheet could melt faster than scientists first thought | | The Greenland ice sheet could melt faster than scientists first thought | 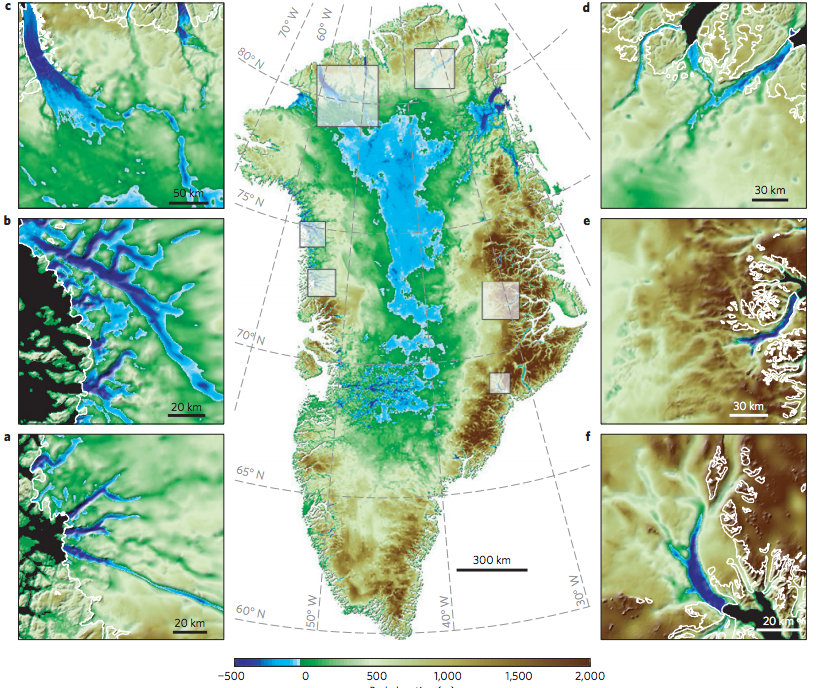
Map of Greenland elevation: Ice covered areas that sit below sea level are marked in blue. Smaller images show individual glaciers and submarine trenches. Source: Morlighem et al. ( 2014). | The Greenland ice sheet may be more vulnerable to climate change than previously thought, scientists reported in a Nature Geoscience paper on Sunday.
The team of US scientists discovered deep channels extending horizontally below the surface of the Greenland sheet, which mean large parts of the glaciers lie on land that's below sea level.
Just like in West Antarctic glaciers, warm water coming into contact with the edge of the glacier forms vast pools under the ice sheet, melting it from the bottom up, the paper explains. | | | Source: carbonbrief | URL: http://www.carbonbrief.org/blog/2014/05/ice-picks-five-pieces-of-ice-news-revealing-earth%E2%80%99s-ice-cover-is-in-serious-decline/
(The text for the image(s) on this Web page was taken from the above source.) |
West Antarctic glaciers are collapsing, and it's "unstoppable"
| West Antarctic glaciers are collapsing, and it's "unstoppable" | 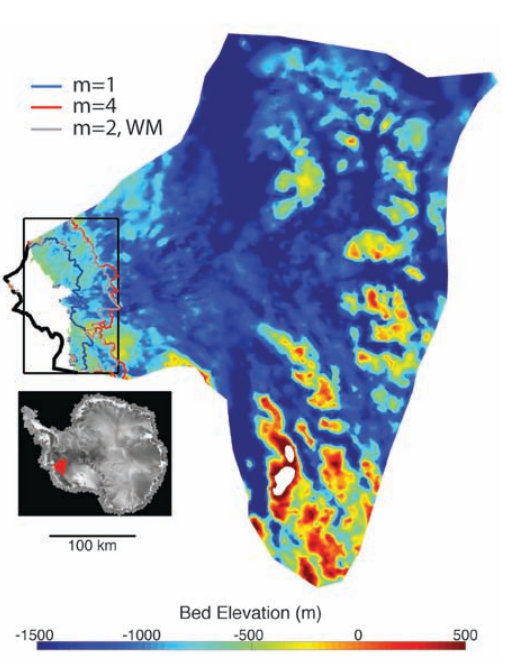
Radar image showing the ice-shelf edge of the Thwaites glacier in West Antarctica (thick black line) and the position of the "grounding line" - where ice meets ocean and goes afloat - under a high warming scenario (red line). Source: Joughin et al,. (2014) | Eye-catching words like "collapse", "irreversible", "unstoppable" and "catastrophic" peppered media coverage last week of two papers charting the demise of West Antarctic glaciers.
The first paper in Science looked at how changes in wind and ocean circulations are bringing warm water in contact with the underside of the Thwaites glacier - one of the biggest in West Antarctica - melting it from the bottom up. Similar things are happening with other glaciers across West Antarctica, explained the second paper in Geophysical Research Letters.
Not only are the glaciers shrinking, but there's nothing to stop them melting completely. That's why scientists are talking about the glaciers' collapse as "irreversible" and "unstoppable".
And without the huge glaciers to prop up the interior of the ice sheet, much larger areas of West Antarctic ice will start slipping into the ocean. This would ultimately raise sea levels by three to four metres, though that would take several centuries, say the scientists.
Here are some key questions on both bits of research answered by experts. | | | Source: carbonbrief | URL: http://www.carbonbrief.org/blog/2014/05/ice-picks-five-pieces-of-ice-news-revealing-earth%E2%80%99s-ice-cover-is-in-serious-decline/
(The text for the image(s) on this Web page was taken from the above source.) |
|
|