Primary reasons for concern about the Earth's future climate, sea level, and ocean acidification
.
| 1. |
CO2 emissions currently match those of the most extreme IPCC emission scenarios |
| 2. |
The Earth is warming dramatically at a steady rate, and most of the extra heat is going into the oceans |
| 3. |
Only 2.3% of extra heat is warming the atmosphere, so the recent slowdown in atmospheric temperature increase is just temporary |
| 4. |
El Nino/La Nina significantly affect atmospheric temperatures, and looking at atmospheric temperature by "event type" shows a steady a steady .16 degree C per decade |
| 6. |
The IPCC has really underestimated when the summer-time Arctic ocean will likely become ice free |
| 7. |
The “equilibrium sea level rise” is likely around 10 meters/° C |
| 8. |
The IPCC is very conservative in is forecasts of sea level rise |
| 9. |
Flooding at high tide will likely make some coastal cities unusable in the near future |
| 10. |
The ocean acidification caused by the increased atmospheric CO2 will likely have devastating consequences |
| 11. |
Carbon from permafrost soils could add as much as 0.4ºF to 0.6ºF of warming by 2100 |
This Fact Page displays text and images related to global warming and climate change
(Hover your mouse over the text below to "popup" a window with a related text.
Click on the text or image to open a new window with a detailed description.)
|
|
| | 1. | | CO2 emissions currently match those of the most extreme IPCC emission scenarios |
If we continue emitting CO2 at the current accelerating rate the result will very likely be a climate that is inhospitable to civilization as we know it 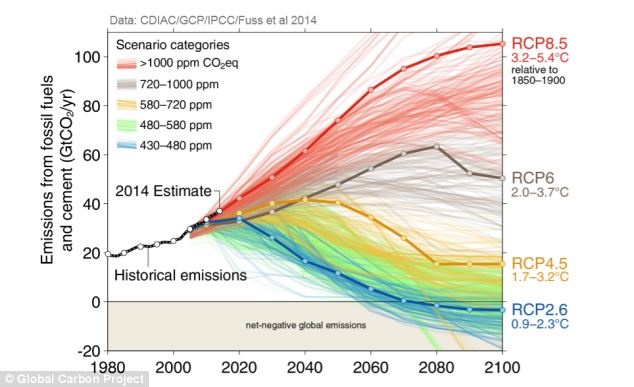 | | | 2. | | The Earth is warming dramatically at a steady rate, and most of the extra heat is going into the oceans |
As a result of the increase in atmospheric CO2, the Earth has been absorbing an excess of about 8 zeta joules of energy/year (the equivalent of a 50 megaton nuclear bomb being exploded every 15 minutes), with almost all of the energy going in to warming the oceans. 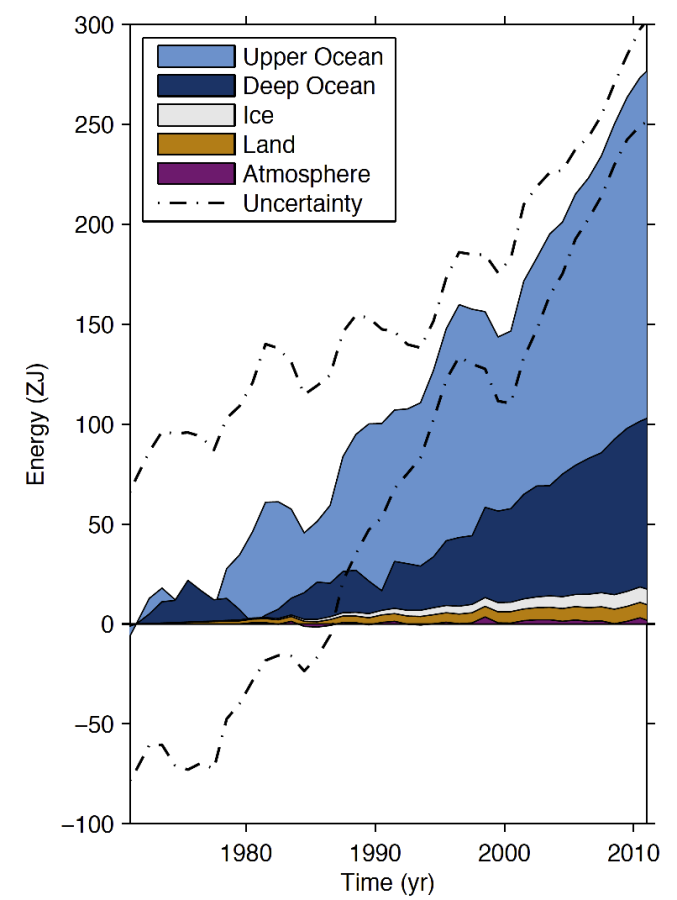 | | | | 3. | | Only 2.3% of extra heat is warming the atmosphere, so the recent slowdown in atmospheric temperature increase is just temporary |
Only about 2.3% of the excess energy is used to warm the atmosphere, while about 1.3% is used to melt glaciers and about 0.8% is used to melt Arctic sea ice. 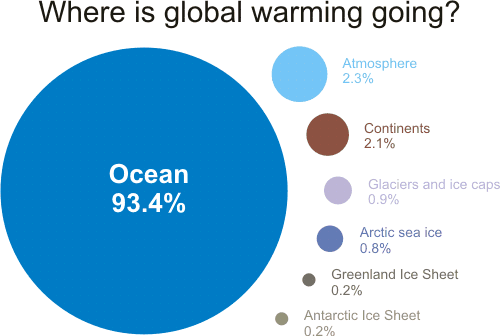 | | | 4. | | El Nino/La Nina significantly affect atmospheric temperatures, and looking at atmospheric temperature by "event type" shows a steady a steady .16 degree C per decade |
Snce El Nino and La Nina have such an impact on global atmospheric temperatures, the best way to look at the atmospheric temperature change is to categorize the global temperature by “type of year”, which indicates that the atmospheric temperatures have been increasing at the same steady rate (about .16°C /decade) since 1970 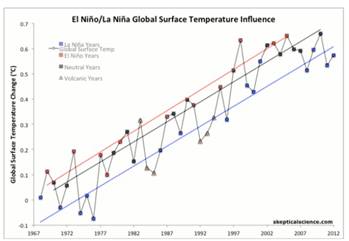 | | | | 6. | | The IPCC has really underestimated when the summer-time Arctic ocean will likely become ice free |
The IPCC has really underestimated when the summer-time Arctic ocean will likely become ice, so it’s temperature estimates are likely low 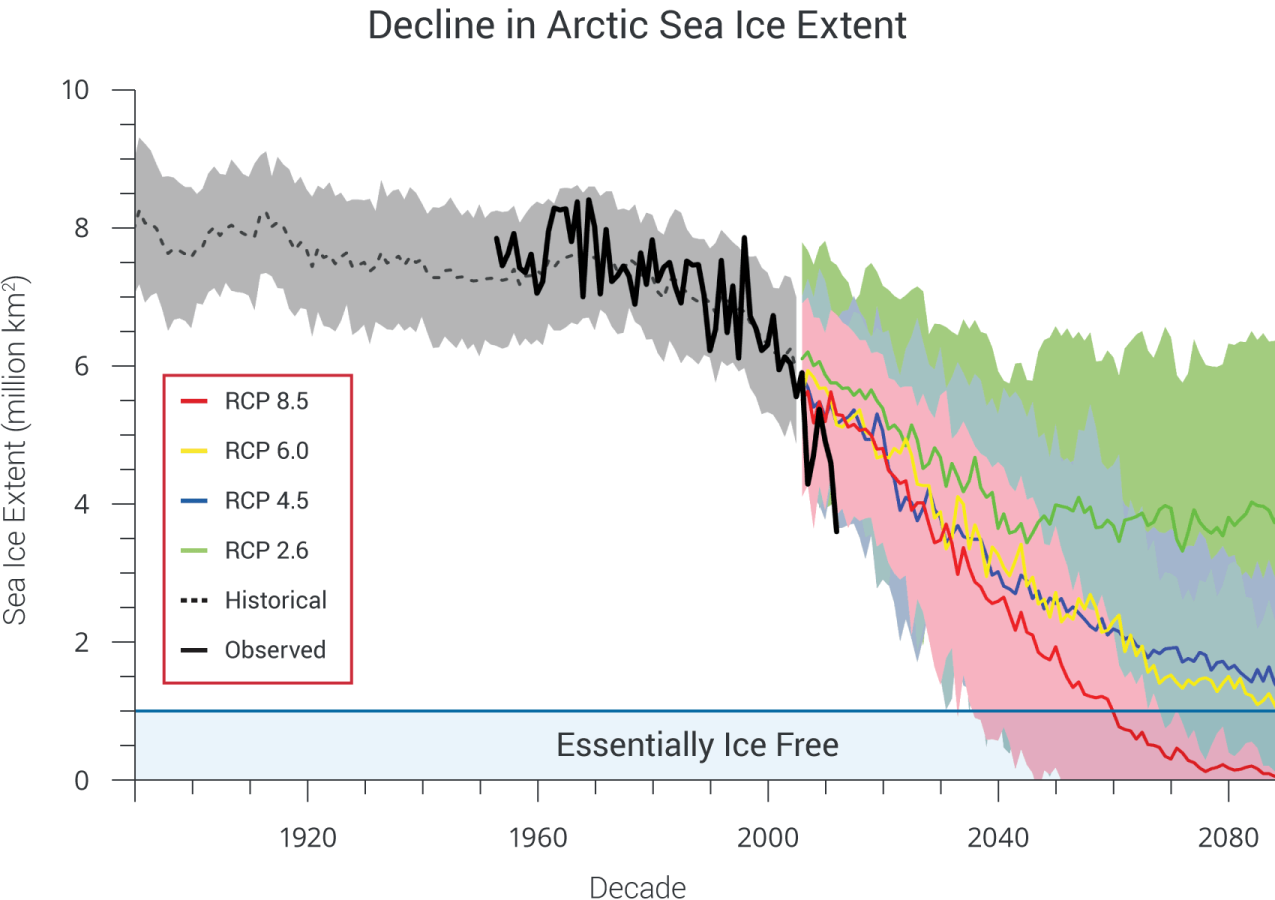 | | | 7. | | The “equilibrium sea level rise” is likely around 10 meters/° C |
We are already committed to at least 30 feet of sea level rise, enough to force the evacuation of most coastal cities 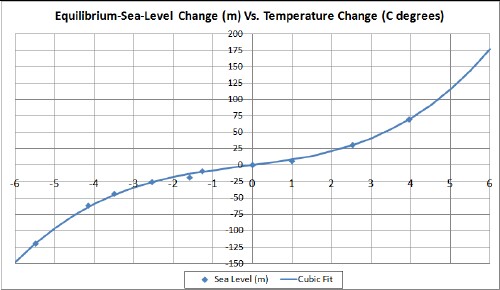 | | | | 8. | | The IPCC is very conservative in is forecasts of sea level rise |
Climate science experts expect that significant sea level rise will occurr much sooner that IPCC does 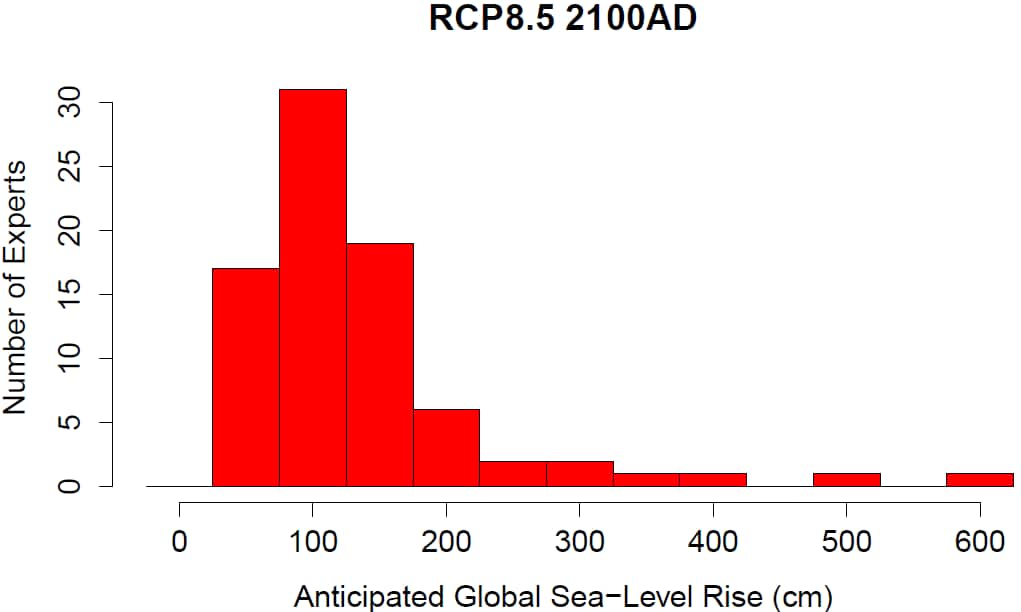 | | | 9. | | Flooding at high tide will likely make some coastal cities unusable in the near future |
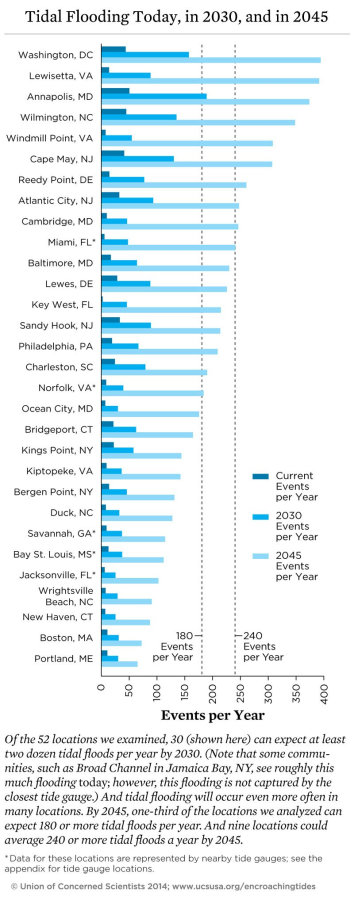 | | | | 10. | | The ocean acidification caused by the increased atmospheric CO2 will likely have devastating consequences |
As a result of the increase in atmospheric CO2, the oceans have become more acidic 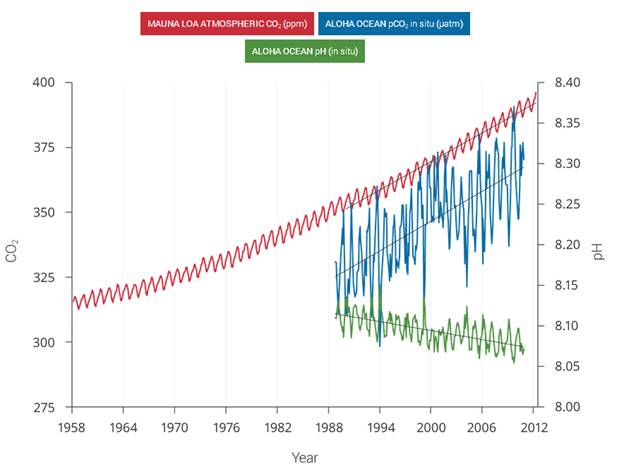 | | | 11. | | Carbon from permafrost soils could add as much as 0.4ºF to 0.6ºF of warming by 2100 |
Permafrost temperatures are increasing over Alaska and much of the Arctic. Regions of discontinuous permafrost in interior Alaska (where annual average soil temperatures are already close to 32°F) are highly vulnerable to thaw. Thawing permafrost releases carbon dioxide and methane – heat-trapping gases that contribute to even more warming. Recent estimates suggest that the potential release of carbon from permafrost soils could add as much as 0.4ºF to 0.6ºF of warming by 2100.150 Methane emissions have been detected from Alaskan lakes underlain by permafrost, 151 and measurements suggest potentially even greater releases from thawing methane hydrates in the Arctic continental shelf of the East Siberian Sea.152 However, the response times of Arctic methane hydrates to climate change are quite long relative to methane’s lifetime in the atmosphere (about a decade).153 More generally, the importance of Arctic methane sources relative to other methane sources, such as wetlands in warmer climates, is largely unknown. The potential for a self-reinforcing feedback between permafrost thawing and additional warming contributes additional uncertainty to the high end of the range of future warming. The projections of future climate shown throughout this report do not include the additional increase in temperature associated with this thawing. | | |
CO2 emissions currently match those of the most extreme IPCC emission scenarios
| Global CO2 Emissions - Projected vs Actual (through 2014) | | If we continue emitting CO2 at the current accelerating rate the result will very likely be a climate that is inhospitable to civilization as we know it | 
Worst Case Carbon Dioxide Emissions Increases Continue — Hitting 40 Billion Tons Per Year in 2013 | (Global carbon emissions continued along a worst-case track during 2013. Note that estimated temperature increases are for this century only. For context, it took 12,000 years for the world to warm 5 degrees Celsius at the end of the last ice age. Image source: Global Carbon Project.)
On the current track, global CO2 emissions will double in about 30 years. This pace of emissions increase is along the worst-case path projected by the UN’s IPCC. One that will hit 8.5 watts per meter squared of additional warming at the top of the Earth’s atmosphere and greater than 1,000 ppm CO2 equivalent greenhouse gas heat forcing by the end of this century.
Such a massive increase from human sources does not include amplifying feedback emissions from global methane or CO2 stores such as those now apparently destabilizing in the Arctic. Such emissions could add an additional 20 to 30 percent or greater heat forcing on top of the human forcing, according to scientific estimates, by the end of this century.
The massive blow would be more than enough to trigger a hothouse extinction event — one that could well rival or exceed the Permian (also known as ‘the great dying’) in its ferocity due to the very rapid pace of the human heat accumulation. | | URL: http://robertscribbler.wordpress.com/2014/09/22/worst-case-carbon-dioxide-emissions-increases-continue-hitting-40-billion-tons-per-year-in-2013/
(The text for the image(s) on this Web page was taken from the above source.) |
The Earth is warming dramatically at a steady rate, and most of the extra heat is going into the oceans
| Energy absorbed by the Earth 1970-2010 - Most of the heat is going into the oceans | | As a result of the increase in atmospheric CO2, the Earth has been absorbing an excess of about 8 zeta joules of energy/year (the equivalent of a 50 megaton nuclear bomb being exploded every 15 minutes), with almost all of the energy going in to warming the oceans. | 
(Box 3.1 Fig 1) Plot of energy accumulation in zettajoules within distinct components of Earth’s climate system relative to 1971 and from 1971–2010 unless otherwise indicated. Ocean warming (heat content change) dominates, with the upper ocean (light blue, above 700 m) contributing more than the deep ocean (dark blue, below 700 m; including below 2000 m estimates starting from 1992). Ice melt (light grey; for glaciers and ice caps, Greenland and Antarctic ice sheet estimates starting from 1992, and Arctic sea ice estimate from 1979–2008); continental (land) warming (orange); and atmospheric warming (purple; estimate starting from 1979) make smaller contributions. Uncertainty in the ocean estimate also dominates the total uncertainty (dot-dashed lines about the error from all five components at 90% confidence intervals). | The oceans have a huge thermal mass compared to the atmosphere and land surface. They act as the planet’s heat storage and transportation system, as the ocean currents redistribute the heat. This is important because if we look at the global surface temperature as an indication of warming, we’re only getting some of the picture. The oceans act as a huge storage heater, and will continue to warm up the lower atmosphere (no matter what changes we make to the atmosphere in the future). | | | Source: johncarlosbaez | URL: http://johncarlosbaez.wordpress.com/2014/04/11/what-does-the-new-ipcc-report-say-about-climate-change-part-4/
(The text for the image(s) on this Web page was taken from the above source.) |
Only 2.3% of extra heat is warming the atmosphere, so the recent slowdown in atmospheric temperature increase is just temporary
| Where is global warming going | | Only about 2.3% of the excess energy is used to warm the atmosphere, while about 1.3% is used to melt glaciers and about 0.8% is used to melt Arctic sea ice. | 
Figure 1: components of global warming for the period 1993 to 2003 calculated from IPCC AR4 5.2.2.3. | The percentages were calculated from Figure 5.4 from Section 5.2.2.3 of the IPCC 4th Assessment Report (h/t to Humanity Rules for the heads up). The IPCC graph shows changes in energy content for two different periods: 1961 to 2003 and 1993 to 2003. The ocean heat figure of 93.4% is almost certainly an underestimate as it only includes ocean heat down to 700 metres (Levitus 2005). | | URL: http://www.skepticalscience.com/Where-is-global-warming-going.html
(The text for the image(s) on this Web page was taken from the above source.) |
El Nino/La Nina significantly affect atmospheric temperatures, and looking at atmospheric temperature by "event type" shows a steady a steady .16 degree C per decade
| El Niño/La Niña Global Surface Temperature Influence - 1967-2012 | | Snce El Nino and La Nina have such an impact on global atmospheric temperatures, the best way to look at the atmospheric temperature change is to categorize the global temperature by “type of year”, which indicates that the atmospheric temperatures have been increasing at the same steady rate (about .16°C /decade) since 1970 |  | | | Source: wunderground.com | | URL: http://www.wunderground.com/blog/JeffMasters/comment.html?entrynum=2374 |
The IPCC has really underestimated when the summer-time Arctic ocean will likely become ice free
| Projected Arctic Sea Ice Decline | | The IPCC has really underestimated when the summer-time Arctic ocean will likely become ice, so it’s temperature estimates are likely low |  | Figure 2.29. Model simulations of Arctic sea ice extent for September (1900-2100)
based on observed concentrations of heat-trapping gases and particles (through
2005) and four scenarios. Colored lines for RCP scenarios are model averages
(CMIP5) and lighter shades of the line colors denote ranges among models for
each scenario. Dotted gray line and gray shading denotes average and range of
the historical simulations through 2005. The thick black line shows observed data
for 1953-2012. These newer model (CMIP5) simulations project more rapid sea ice
loss compared to the previous generation of models (CMIP3) under similar forcing
scenarios, although the simulated September ice losses under all scenarios still
lag the observed loss of the past decade. Extrapolation of the present observed
trend suggests an essentially ice-free Arctic in summer before mid-century.139 The
Arctic is considered essentially ice-free when the areal extent of ice is less than
one million square kilometers. (Figure source: adapted from Stroeve et al. 2012136). | | | Source: National Climate Assessment | | URL: http://data.globalchange.gov/file/6c06e9fb-29ea-41c1-acf5-c81ed0cbd831 |
The “equilibrium sea level rise” is likely around 10 meters/° C
| Equilibrium sea level change relative to temperature change | | We are already committed to at least 30 feet of sea level rise, enough to force the evacuation of most coastal cities | 
- The point at about -5.5C° is for the Last Glacial Maximum about 20,000 years before present (ybp).
- The point at about -4.2C° is for the minimum about 112,000 ybp.
- The point at about -3.5C° is for the minimum about 89,000 ybp.
- The point at about -2.5C° is for the minimum about 60,000 ybp.
- The point at about -1.6C° is for the maximum about 81,000 ybp.
- The point at about -1.3C° is for the maximum about 106,000 ybp
- The point at about +1C° is for the Eemian geological period (the previous Major Interglacial) about 125,000 years ybp.
- The point slightly above +2.5C° is for the Pliocene geological period about 3x10⁶ ybp.
- The point slightly below +4C° is for the Eocene geological period about 40x106 ybp.
- The points chosen during the last Major Ice Age (125,000 ybp to 20,000 ybp) are for maxima and minima. In the interest of truthfulness, not all the other data points in the 2nd reference fit the curve so well.
| Up to a 2 degree C increase, the expected sea level rise is about 10 meters per degree C (8 feet per degree F) | | | Source: L. David Roper | | URL: http://www.roperld.com/science/sealevelvstemperature.htm |
The IPCC is very conservative in is forecasts of sea level rise
| RCP 8.5 Sea Level rise expected by experts | | Climate science experts expect that significant sea level rise will occurr much sooner that IPCC does | 
The bulk of experts seem to think we'll see somewhere around 1 meter of sea-level rise by 2100 (some forecasts lower, some higher), if emissions continue unchecked. Then there are about a dozen pessimists worried about even larger rises: | There's not as much polarization among experts as you might think. The chart below comes from Stefan Rahmstorf, one of the authors of the paper. He notes over at Real Climate that there aren't two wildly opposing "camps" of sea-level experts, as press accounts have sometimes suggested. | | | URL: http://www.washingtonpost.com/blogs/wonkblog/wp/2013/11/26/how-high-will-sea-levels-rise-lets-ask-the-experts/ |
Flooding at high tide will likely make some coastal cities unusable in the near future
| Local Sea Level Rise and Tidal Flooding, 1970–2012 (Boston, MA; Atlantic City, NJ; Norfolk, VA; Charleston, SC) |  | Flooding during high tides—something that rarely occurred in the past—is now common in some places and is projected to grow to the point that sections of coastal cities may flood so often they would become unusable in the near future, according to a report the Union of Concerned Scientists (UCS) released today, “Encroaching Tides: How Sea Level Rise and Tidal Flooding Threaten U.S. East and Gulf Coast Communities over the Next 30 Years.” Today scores of coastal communities are seeing more frequent flooding during high tides. As sea level rises higher over the next 15 to 30 years, tidal flooding is expected to occur more often, cause more disruption, and even render some areas unusable — all within the time frame of a typical home mortgage. | | | Source: ucs | | URL: http://www.ucsusa.org/global_warming/impacts/effects-of-tidal-flooding-and-sea-level-rise-east-coast-gulf-of-mexico#.VGjJfTTF9bI |
The ocean acidification caused by the increased atmospheric CO2 will likely have devastating consequences
| Ocean pH vs Atmospheric ppm 1958 to 2012 | | As a result of the increase in atmospheric CO2, the oceans have become more acidic | 
Figure 2.30: The correlation between rising levels of CO2 in the atmosphere (red) at Mauna Loa and rising CO2 levels (blue) and falling pH (green) in the nearby ocean at Station Aloha. As CO2 accumulates in the ocean, the water becomes more acidic (the pH declines). (Figure source: modified from Feely et al. 2009). | As human-induced emissions of carbon dioxide (CO2) build up in the atmosphere, excess CO2 is dissolving into the oceans where it reacts with seawater to form carbonic acid, lowering ocean pH levels (“acidification”) and threatening a number of marine ecosystems. Currently, the oceans absorbs about a quarter of the CO2 humans produce every year. Over the last 250 years, the oceans have absorbed 560 billion tons of CO2, increasing the acidity of surface waters by 30%.,, Although the average oceanic pH can vary on interglacial timescales, the current observed rate of change is roughly 50 times faster than known historical change., Regional factors such as coastal upwelling, changes in discharge rates from rivers and glaciers, sea ice loss, and urbanization have created “ocean acidification hotspots” where changes are occurring at even faster rates. The acidification of the oceans has already caused a suppression of carbonate ion concentrations that are critical for marine calcifying animals such as corals, zooplankton, and shellfish. Many of these animals form the foundation of the marine food web. Today, more than a billion people worldwide rely on food from the ocean as their primary source of protein. Ocean acidification puts this important resource at risk.
Observations have shown that the northeastern Pacific Ocean, including the Arctic and sub-Arctic seas, is particularly susceptible to significant shifts in pH and calcium carbonate saturation levels. Recent analyses show that large areas of the oceans along the U.S. west coast,, the Bering Sea, and the western Arctic Ocean, will become difficult for calcifying animals within the next 50 years. In particular, animals that form calcium carbonate shells, including corals, crabs, clams, oysters, and tiny free-swimming snails called pteropods, could be particularly vulnerable, especially during the larval stage.,,, | | | Source: National Climate Assessment | URL: http://nca2014.globalchange.gov/report/our-changing-climate/ocean-acidification
(The text for the image(s) on this Web page was taken from the above source.) |
Carbon from permafrost soils could add as much as 0.4ºF to 0.6ºF of warming by 2100
| Carbon from permafrost soils could add as much as 0.4ºF to 0.6ºF of warming by 2100 | | Permafrost temperatures are increasing over Alaska and much of the Arctic. Regions of discontinuous permafrost in interior Alaska (where annual average soil temperatures are already close to 32°F) are highly vulnerable to thaw. Thawing permafrost releases carbon dioxide and methane – heat-trapping gases that contribute to even more warming. Recent estimates suggest that the potential release of carbon from permafrost soils could add as much as 0.4ºF to 0.6ºF of warming by 2100.150 Methane emissions have been detected from Alaskan lakes underlain by permafrost, 151 and measurements suggest potentially even greater releases from thawing methane hydrates in the Arctic continental shelf of the East Siberian Sea.152 However, the response times of Arctic methane hydrates to climate change are quite long relative to methane’s lifetime in the atmosphere (about a decade).153 More generally, the importance of Arctic methane sources relative to other methane sources, such as wetlands in warmer climates, is largely unknown. The potential for a self-reinforcing feedback between permafrost thawing and additional warming contributes additional uncertainty to the high end of the range of future warming. The projections of future climate shown throughout this report do not include the additional increase in temperature associated with this thawing. | | | Source: National Climate Assessment | | URL: http://nca2014.globalchange.gov/report/our-changing-climate/melting-ice |
|
|