Earth System Science Data
This Fact Page displays text and images related to global warming and climate change
(Hover your mouse over the text below to "popup" a window with a related text.
Click on the text or image to open a new window with a detailed description.)
|
|
Global anthropogenic emissions (excl. biomass burning)
| Global anthropogenic emissions (excl. biomass burning) | 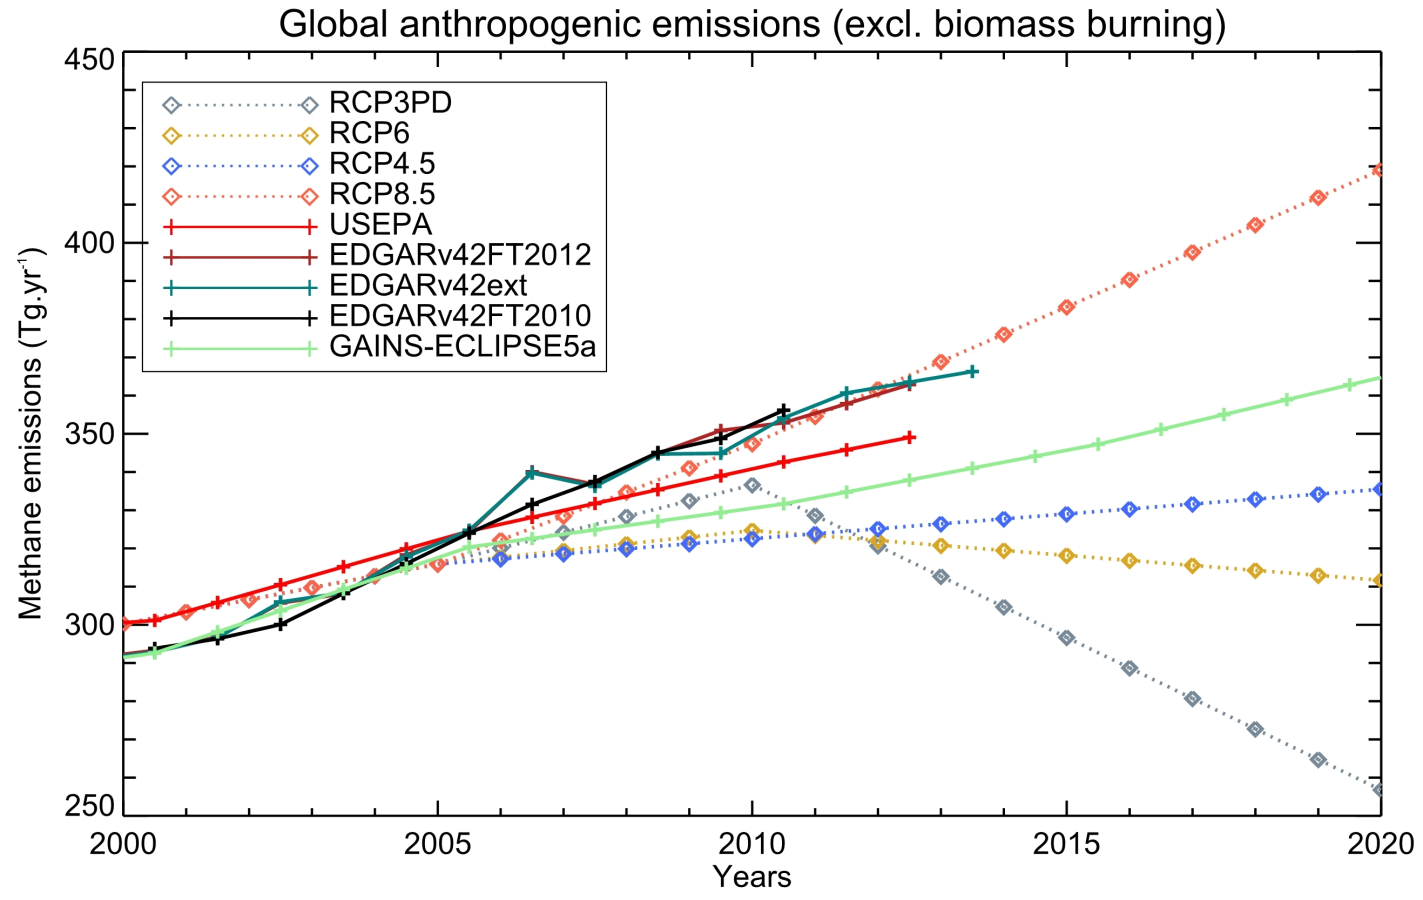
Figure 2. Global anthropogenic methane emissions (excluding biomass burning) from historical inventories and future projections (in Tg CH4 yr-1). USEPA and GAINS estimates have been linearly interpolated from the 10- or 5-year original products to yearly values. After 2005, USEPA original estimates are projections. | | | Source: Earth System Science Data | URL: http://www.earth-syst-sci-data.net/8/697/2016/essd-8-697-2016.pdf
(The text for the image(s) on this Web page was taken from the above source.) |
Map of areas and locations for geological emissions of methane
| Map of areas and locations for geological emissions of methane | 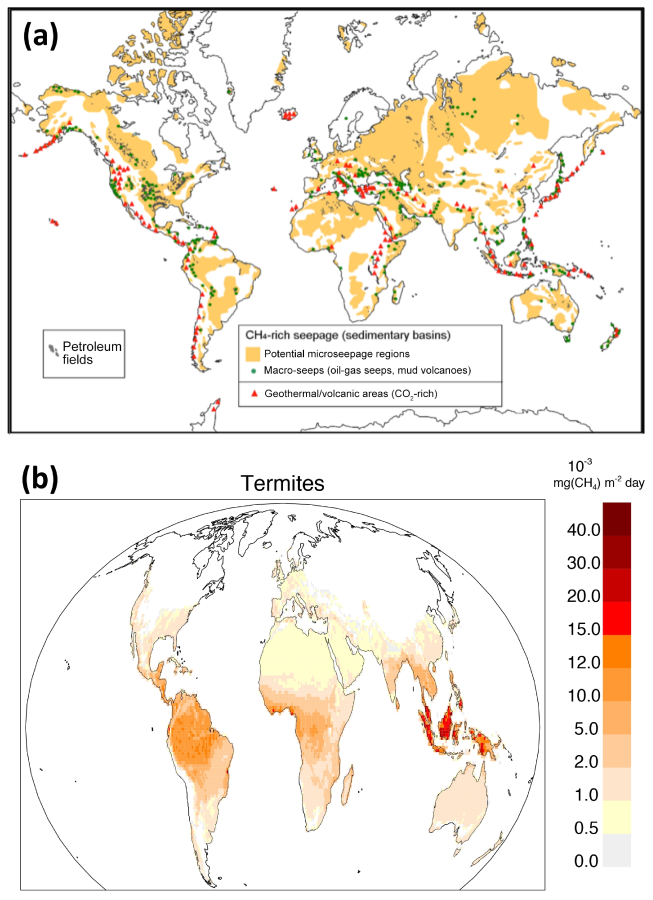
Figure 4. (a) Map of areas and locations for geological emissions of methane related to the different categories mentioned in the text (Sect. 3.2.3). (b) Climatological CH4 emissions from termites over the period 2000–2007 (Sect. 3.2.4). | | | Source: Earth System Science Data | URL: http://www.earth-syst-sci-data.net/8/697/2016/essd-8-697-2016.pdf
(The text for the image(s) on this Web page was taken from the above source.) |
Methane Concentration and Growth Rate (1980-2012)
| Methane Concentration and Growth Rate (1980-2012) | 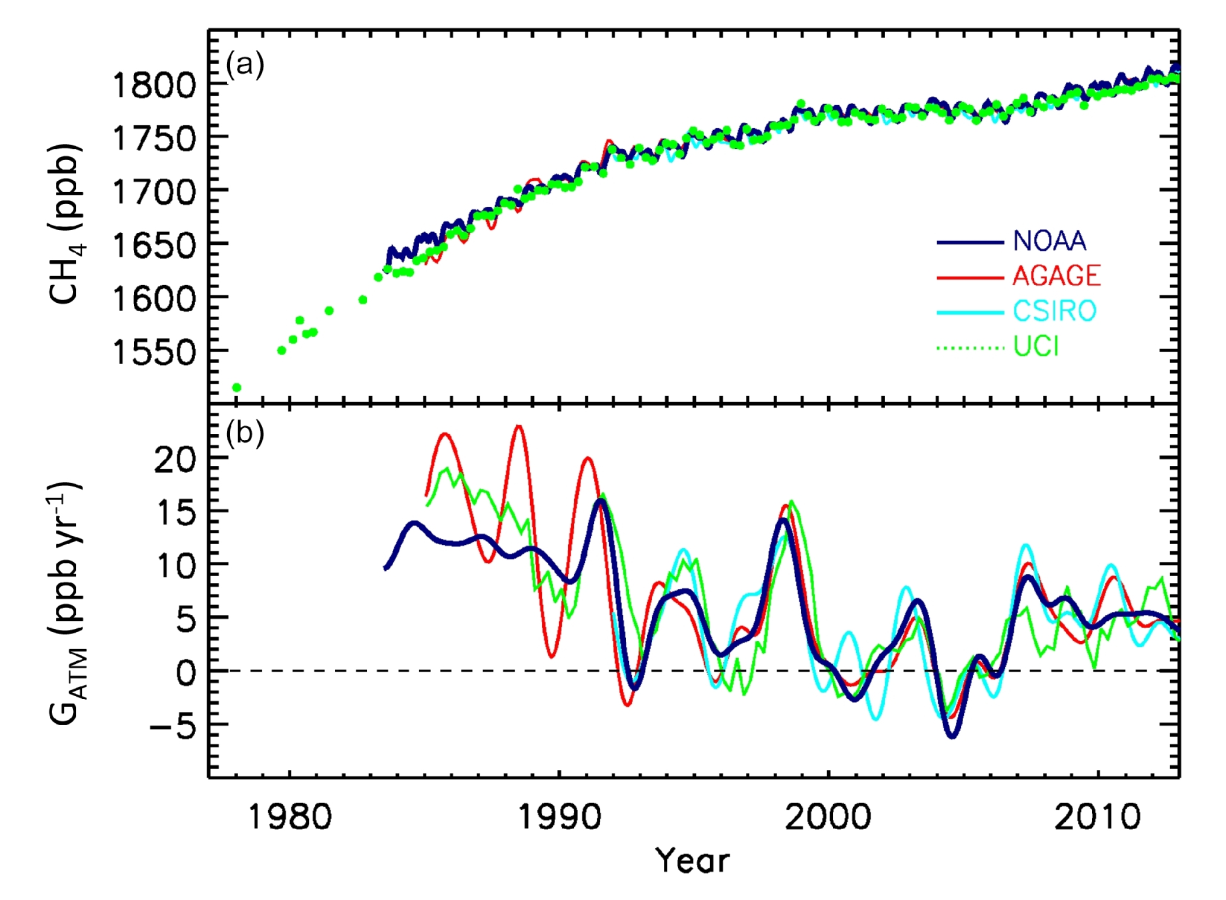
Figure 1. Globally averaged atmospheric CH4 (ppb) (a) and its annual growth rate GATM (ppb yr-1) (b) from four measure-
ment programmes: National Oceanic and Atmospheric Adminis- tration (NOAA), Advanced Global Atmospheric Gases Experiment (AGAGE), Commonwealth Scientific and Industrial Research Or- ganisation (CSIRO), and University of California, Irvine (UCI). Detailed descriptions of methods are given in the Supplement of Kirschke et al. (2013). | | | Source: Earth System Science Data | URL: http://www.earth-syst-sci-data.net/8/697/2016/essd-8-697-2016.pdf
(The text for the image(s) on this Web page was taken from the above source.) |
Methane emissions from four source categories
| Methane emissions from four source categories | 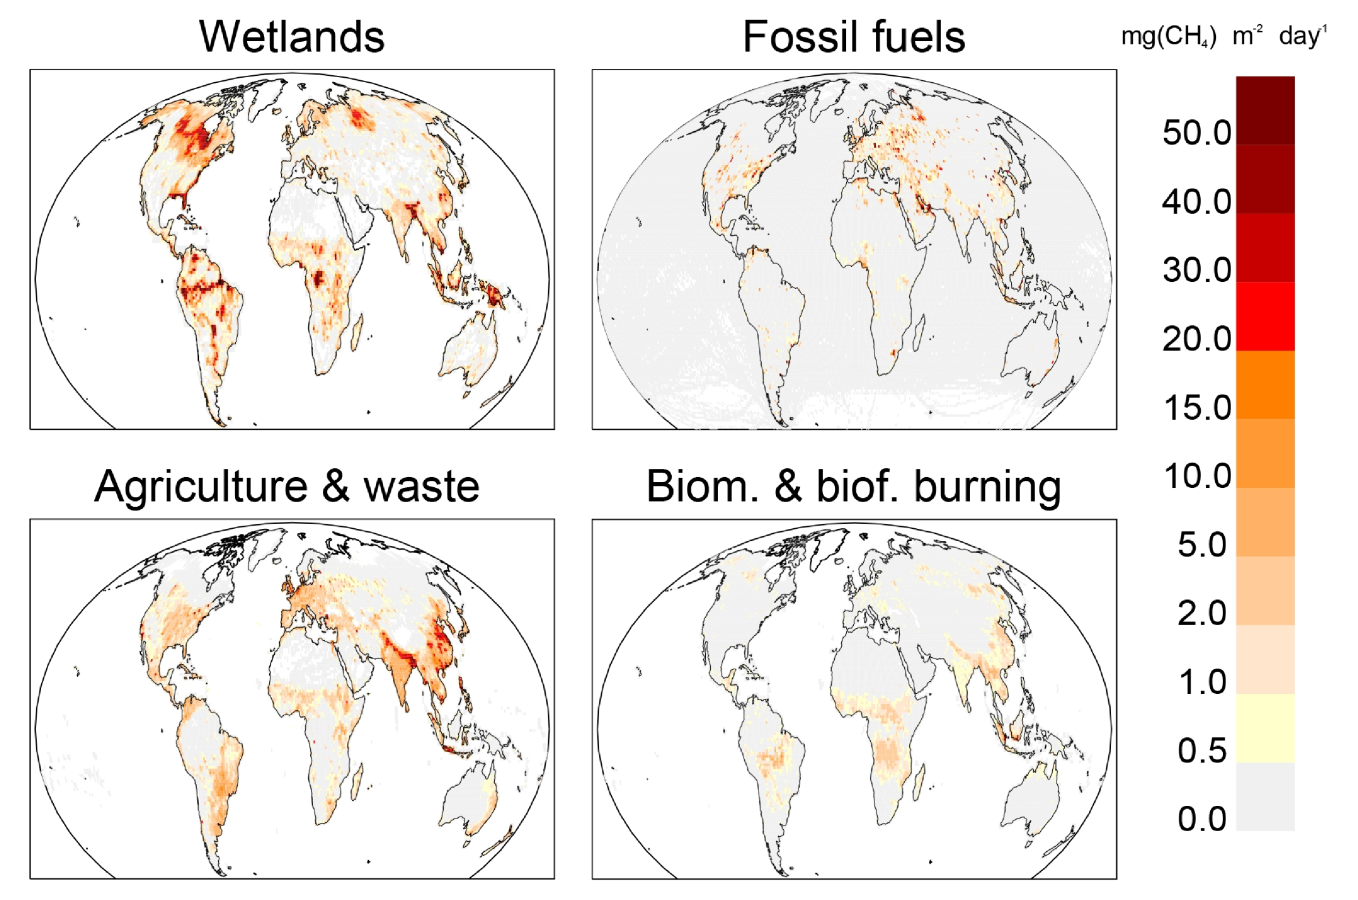
Figure 3. Methane emissions from four source categories: natural wetlands, fossil fuels, agriculture and waste, and biomass and biofuel burning for the 2003–2012 decade in mg CH4 m-2 day-1. The wetland emission map represents the mean daily emission average over the 11 biogeochemical models listed in Table 1 and over the 2003–2012 decade. Fossil fuel and agriculture and waste emission maps are derived
from the mean estimates of EDGARv4.2FT2010 and GAINS models. The biomass and biofuel burning map results from the mean of the biomass burning inventories listed in Table 1 added to the mean of the biofuel estimate from EDGARv4.2FT2010 and GAINS models. | | | Source: Earth System Science Data | URL: http://www.earth-syst-sci-data.net/8/697/2016/essd-8-697-2016.pdf
(The text for the image(s) on this Web page was taken from the above source.) |
Methane global emissions - 2003-2012 decade
| Methane global emissions - 2003-2012 decade | 
Figure 5. Methane global emissions from the five broad cate-
gories (see Sect. 2.3) for the 2003–2012 decade for top-down in- versions models (left light-coloured boxplots) in Tg CH4 yr-1 and for bottom-up models and inventories (right dark-coloured box-
plots). Median value, and first and third quartiles are presented in the boxes. The whiskers represent the minimum and maximum val- ues when suspected outliers are removed (see Sect. 2.2). Suspected outliers are marked with stars when existing. Bottom-up quartiles are not available for bottom-up estimates. Mean values are repre-
sented with “+” symbols; these are the values reported in Table 2. | | | Source: Earth System Science Data | URL: http://www.earth-syst-sci-data.net/8/697/2016/essd-8-697-2016.pdf
(The text for the image(s) on this Web page was taken from the above source.) |
Regional CH4 budget in Tg CH4 yr-1 per category
| Regional CH4 budget in Tg CH4 yr-1 per category | 
Figure 7. Regional CH4 budget in Tg CH4 yr-1 per category (same as for the global emissions in Fig. 6) and map of the 14 continental regions considered in this study. The CH4 emissions are given for the five categories from left to right (wetlands, biomass burning, fossil fuels, agriculture and waste, and other natural). Top-down estimates are given by the left dark-coloured boxes and bottom-up estimates by the right light-coloured boxes. | | | Source: Earth System Science Data | URL: http://www.earth-syst-sci-data.net/8/697/2016/essd-8-697-2016.pdf
(The text for the image(s) on this Web page was taken from the above source.) |
Regional methane emissions - 2003-2012 decade
| Regional methane emissions - 2003-2012 decade | 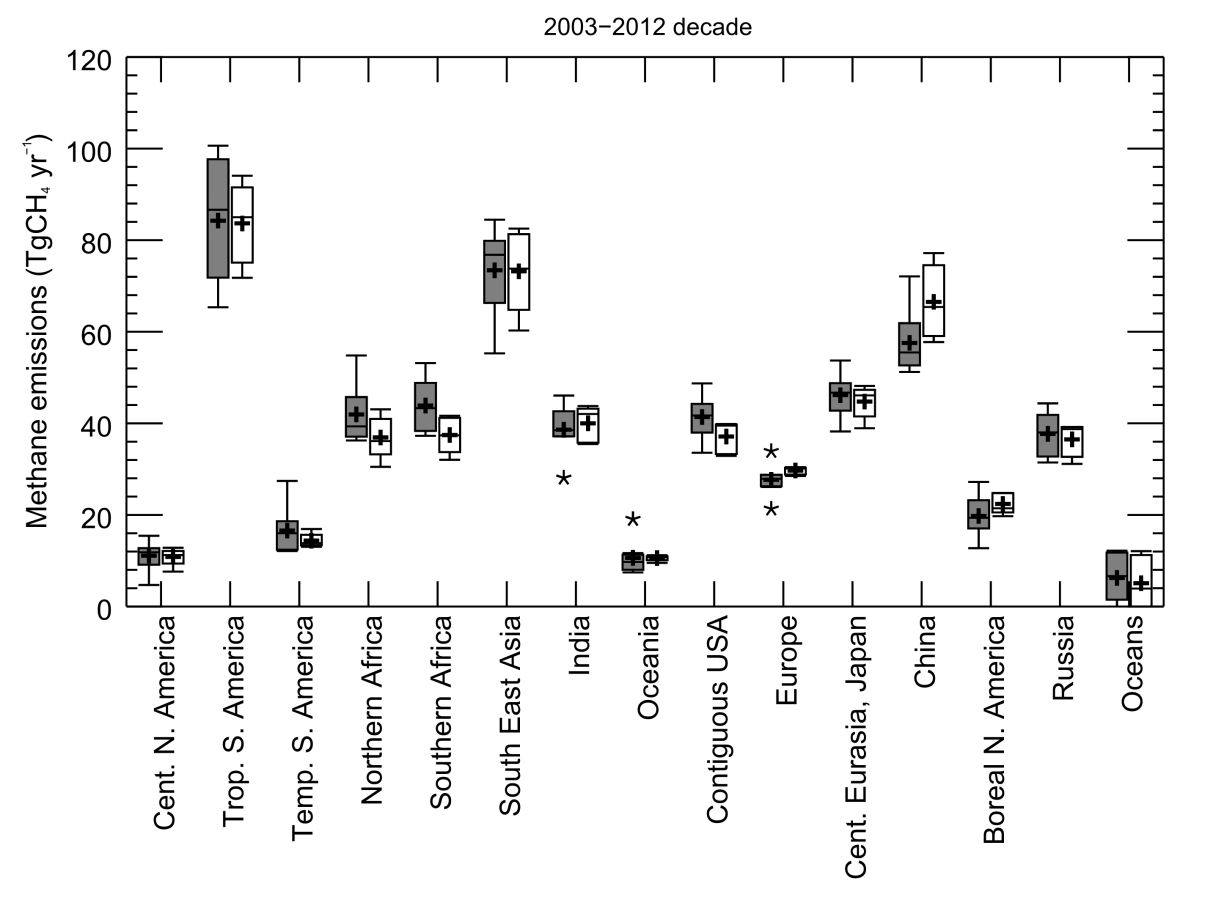
Figure 6. Regional methane emissions for the 2003–2012 decade from top-down inversions (grey) and for the prior estimates used in the inversions (white). Each boxplot represents the range of the top-down estimates inferred by the ensemble of inversion approach. Median value, and first and third quartiles are presented in the box. The whiskers represent the minimum and maximum values when suspected outliers are removed (see Sect. 2.2). Outliers are marked with stars when existing. Mean values are represented with “+” symbols; these are the values reported in Table 4. | | | Source: Earth System Science Data | URL: http://www.earth-syst-sci-data.net/8/697/2016/essd-8-697-2016.pdf
(The text for the image(s) on this Web page was taken from the above source.) |
Table 1. Bottom-up models and inventories used in this study.
Table 2. Global methane emissions by source type
| Table 2. Global methane emissions by source type | 
Table 2. Global methane emissions by source type in Tg CH4 yr-1 from Kirschke et al. (2013) (left columns) and for this work using bottom-up (middle column) and top-down (right columns). As top-down models cannot fully separate individual processes, only emissions for five categories are provided (see text). Uncertainties are reported as [min–max] range of reported studies. Differences of 1 Tg CH4 yr-1
in the totals can occur due to rounding errors. | | | Source: Earth System Science Data | URL: http://www.earth-syst-sci-data.net/8/697/2016/essd-8-697-2016.pdf
(The text for the image(s) on this Web page was taken from the above source.) |
Table 3. Top-down studies
| Table 3. Top-down studies | 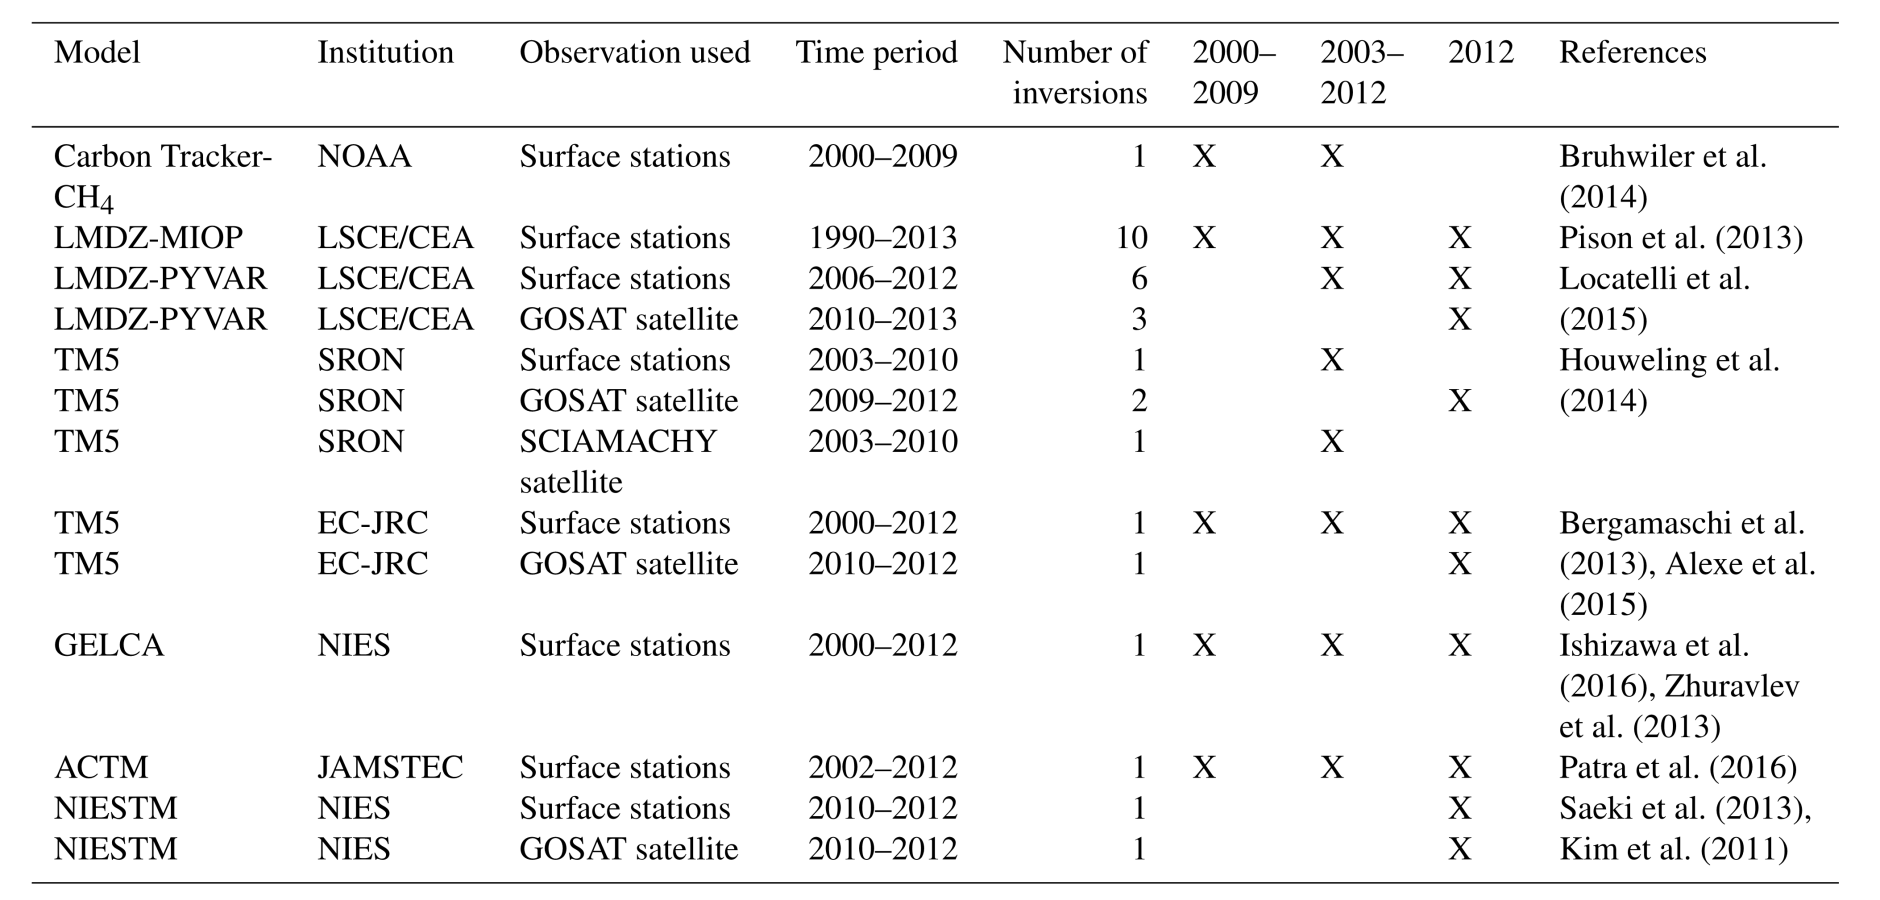
Table 3. Top-down studies used in this study with their contribution to the decadal and yearly estimates. For decadal means, top-down studies have to provide at least 6 years over the decade to contribute to the estimate. All top-down studies provided both total and per categories (including soil uptake) partitioning. | | | Source: Earth System Science Data | URL: http://www.earth-syst-sci-data.net/8/697/2016/essd-8-697-2016.pdf
(The text for the image(s) on this Web page was taken from the above source.) |
Table 4. Global, latitudinal and regional methane emissions
| Table 4. Global, latitudinal and regional methane emissions | 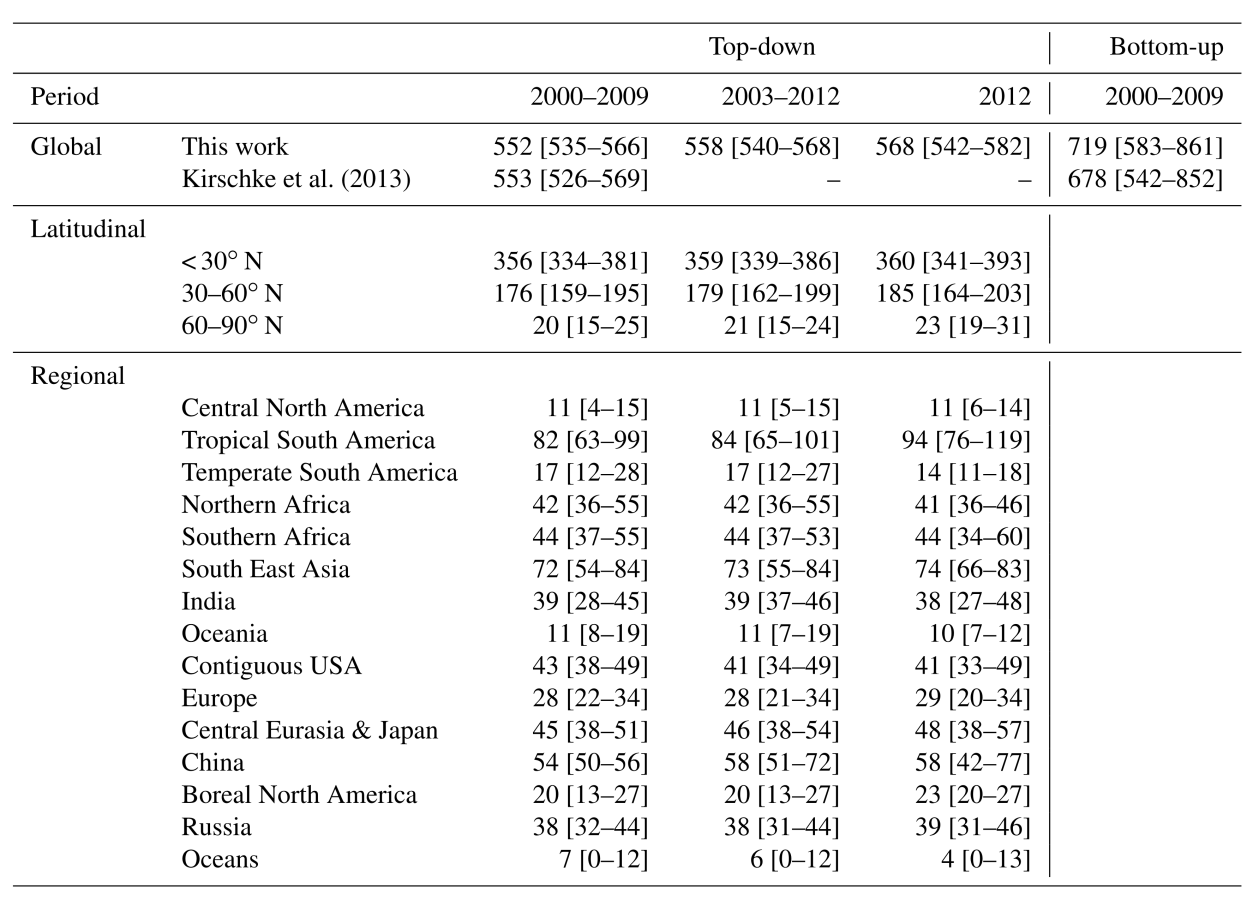
Table 4. Global, latitudinal and regional methane emissions in Tg CH4 yr-1, as decadal means (2000–2009 and 2003–2012) and for the year 2012, for this work using top-down inversions. Global emissions are also compared with Kirschke et al. (2013) for top-down and bottom-up for 2000–2009. Uncertainties are reported as [min–max] range of reported studies. Differences of 1 Tg CH4 yr-1 in the totals can
occur due to rounding errors | | | Source: Earth System Science Data | URL: http://www.earth-syst-sci-data.net/8/697/2016/essd-8-697-2016.pdf
(The text for the image(s) on this Web page was taken from the above source.) |
|
|