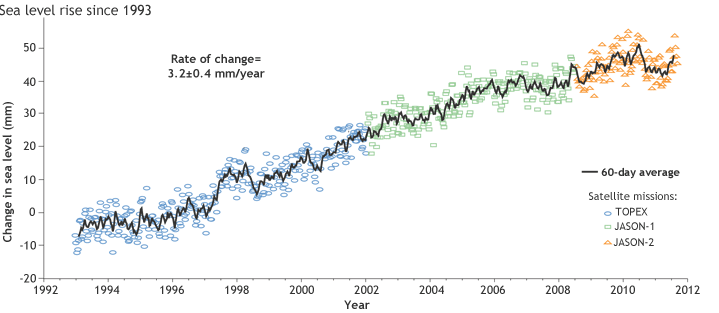
 | From the cited public-domain source: "Over the past few decades, tide gauges along the coasts and altimeters on satellites have documented a gradual rise in global average sea level. The graph above shows satellite-based estimates of sea level since 1992. Colored symbols show data collected by successive satellite missions. The average rate of global sea level rise is 3.2 millimeters per year, give or take 0.4 mm. [...] In [2011], global sea levels dipped below the long-term trend of rising sea levels that has been observed in the past few decades. But by late in the year, as La Niña began to phase out, global waters were rising sharply once again. Rising seas are reshaping the world’s coastlines and affecting some of the most densely populated areas on Earth." |