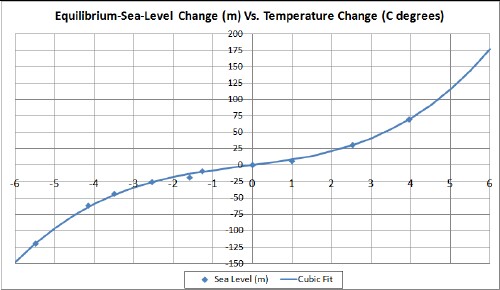
- The point at about -5.5C° is for the Last Glacial Maximum about 20,000 years before present (ybp).
- The point at about -4.2C° is for the minimum about 112,000 ybp.
- The point at about -3.5C° is for the minimum about 89,000 ybp.
- The point at about -2.5C° is for the minimum about 60,000 ybp.
- The point at about -1.6C° is for the maximum about 81,000 ybp.
- The point at about -1.3C° is for the maximum about 106,000 ybp
- The point at about +1C° is for the Eemian geological period (the previous Major Interglacial) about 125,000 years ybp.
- The point slightly above +2.5C° is for the Pliocene geological period about 3x10⁶ ybp.
- The point slightly below +4C° is for the Eocene geological period about 40x106 ybp.
- The points chosen during the last Major Ice Age (125,000 ybp to 20,000 ybp) are for maxima and minima. In the interest of truthfulness, not all the other data points in the 2nd reference fit the curve so well.
| Up to a 2 degree C increase, the expected sea level rise is about 10 meters per degree C (8 feet per degree F) |